Bayut’s H1 2024 Dubai Rental Market Report
- At a Glance
- Affordable Apartment Rentals
- Mid-Tier Apartment Rentals
- Luxury Apartment Rentals
- Affordable Villa Rentals
- Mid-Tier Villa Rentals
- Luxury Villa Rentals
As the first half of the year draws to a close, it’s clear that rental property prices in Dubai have continued to rise. Our extensive Dubai Rental Market Report for H1 2024 explores the changes in rental prices for both apartments and villas across major residential districts in the emirate, as recorded on Bayut.
We have segmented the popular areas for rental apartments and villas into ‘Affordable,’ ‘Mid-tier’ and ‘Luxury’ categories to provide a more tailored view of the Dubai rental market.
AT A GLANCE: THE RENTAL MARKET IN DUBAI H1 2024
An examination of rental property prices in Dubai indicates a consistent upward trend across the affordable, mid-tier and luxury market segments:
- Rental costs for affordable properties have risen from between 1% and 31%.
- The mid-tier segment has seen increases of up to 16%.
- The asking rents for high-end properties have generally climbed by up to 12%.
- Data shows that tenants looking for affordable apartments preferred the properties in Deira, whereas Jumeirah Village Circle remained the popular choice for mid-tier priced rental apartments. Those looking for luxury apartment rentals, gravitated towards Dubai Marina.
- For affordable villa rentals, DAMAC Hills 2 was the most prominent choice and Town Square appealed most to tenants in the mid-tier price sector. The high-end villas in Dubai Hills Estate remained popular in the luxury category.
According to Dubai Transactions data, 272,294 rental transactions, totaling AED 20.7 billion, were recorded in H1 2024.
To identify consumer search and rental trends in the H1 Dubai property market 2024, our data analysts have compared the average asking rents advertised on Bayut during H1 2024 (excluding room share) to those observed during H2 2023.
DEIRA IS THE MOST POPULAR AREA TO RENT AFFORDABLE APARTMENTS IN DUBAI
RENTAL PRICES IN DUBAI FOR AFFORDABLE APARTMENTS IN POPULAR AREAS – DUBAI RENTAL MARKET REPORT H1 2024
POPULAR AREAS | TRANSACTION PRICE Avg. Yearly RentChange from H2 2023 | STUDIO Avg. Yearly RentChange from H2 2023 | 1-BED Avg. Yearly RentChange from H2 2023 | 2-BED Avg. Yearly RentChange from H2 2023 |
|---|---|---|---|---|
| Deira | TRANSACTION PRICE Avg. Yearly RentChange from H2 2023
| STUDIO Avg. Yearly RentChange from H2 2023
| 1-BED Avg. Yearly RentChange from H2 2023
| 2-BED Avg. Yearly RentChange from H2 2023
|
| Al Nahda | TRANSACTION PRICE Avg. Yearly RentChange from H2 2023
| STUDIO Avg. Yearly RentChange from H2 2023
| 1-BED Avg. Yearly RentChange from H2 2023
| 2-BED Avg. Yearly RentChange from H2 2023
|
| International City | TRANSACTION PRICE Avg. Yearly RentChange from H2 2023
| STUDIO Avg. Yearly RentChange from H2 2023
| 1-BED Avg. Yearly RentChange from H2 2023
| 2-BED Avg. Yearly RentChange from H2 2023
|
- Tenants looking for affordable accommodation gravitated towards the rental apartments in Deira, Al Nahda and International City.
- The rents for apartments in these areas increased by between 4% and 32%, with studio flats in Al Nahda reporting the highest surge.
- These significant price upticks emphasise the increased demand for cheaper apartments, consequent to the continually rising rental costs across the emirate.
JUMEIRAH VILLAGE CIRCLE IS THE MOST POPULAR AREA TO RENT MID-TIER APARTMENTS IN DUBAI
RENTAL PRICES FOR MID-TIER APARTMENTS IN POPULAR DISTRICTS – DUBAI RENTAL MARKET REPORT FOR H1 2024
POPULAR AREAS | TRANSACTION PRICE Avg. Yearly RentChange from H2 2023 | STUDIO Avg. Yearly RentChange from H2 2023 | 1-BED Avg. Yearly RentChange from H2 2023 | 2-BED Avg. Yearly RentChange from H2 2023 |
|---|---|---|---|---|
| Jumeirah Village Circle | TRANSACTION PRICE Avg. Yearly RentChange from H2 2023
| STUDIO Avg. Yearly RentChange from H2 2023
| 1-BED Avg. Yearly RentChange from H2 2023
| 2-BED Avg. Yearly RentChange from H2 2023
|
| Bur Dubai | TRANSACTION PRICE Avg. Yearly RentChange from H2 2023
| STUDIO Avg. Yearly RentChange from H2 2023
| 1-BED Avg. Yearly RentChange from H2 2023
| 2-BED Avg. Yearly RentChange from H2 2023
|
| Dubai Silicon Oasis | TRANSACTION PRICE Avg. Yearly RentChange from H2 2023
| STUDIO Avg. Yearly RentChange from H2 2023
| 1-BED Avg. Yearly RentChange from H2 2023
| 2-BED Avg. Yearly RentChange from H2 2023
|
- In the mid-tier segment, tenants were mostly inclined towards the rental apartments in Jumeirah Village Circle, Bur Dubai and Dubai Silicon Oasis.
- The price for renting apartments in these areas increased by between 5% and 16%. The most prominent uptick was observed in the rental cost of 3-bed flats in Bur Dubai.
DUBAI MARINA REMAINS THE TOP CHOICE FOR LUXURY APARTMENT RENTALS
RENTAL PRICES IN DUBAI FOR LUXURY APARTMENTS – BAYUT’S DUBAI REAL ESTATE RENTAL MARKET REPORT H1 2024
POPULAR AREAS | TRANSACTION PRICE Avg. Yearly RentChange from H2 2023 | 1-BED Avg. Yearly RentChange from H2 2023 | 2-BED Avg. Yearly RentChange from H2 2023 | 3-BED Avg. Yearly RentChange from H2 2023 |
|---|---|---|---|---|
| Dubai Marina | TRANSACTION PRICE Avg. Yearly RentChange from H2 2023
| 1-BED Avg. Yearly RentChange from H2 2023
| 2-BED Avg. Yearly RentChange from H2 2023
| 3-BED Avg. Yearly RentChange from H2 2023
|
| Business Bay | TRANSACTION PRICE Avg. Yearly RentChange from H2 2023
| 1-BED Avg. Yearly RentChange from H2 2023
| 2-BED Avg. Yearly RentChange from H2 2023
| 3-BED Avg. Yearly RentChange from H2 2023
|
| Downtown Dubai | TRANSACTION PRICE Avg. Yearly RentChange from H2 2023
| 1-BED Avg. Yearly RentChange from H2 2023
| 2-BED Avg. Yearly RentChange from H2 2023
| 3-BED Avg. Yearly RentChange from H2 2023
|
- For luxury apartment rentals, Dubai Marina, Business Bay and Downtown Dubai remain tenant favourites.
- Consistent with the overall property price trends observed in Bayut’s Dubai Rental Market Report H1 2024, these areas have reported rental hikes of up to 7% for most bed-types.
- The 2-bed and 3-bed apartments for rent in Downtown Dubai reported a 4% to 6% decrease in rental costs. This could be attributed to tenants preferring the more spacious villas over apartments within the same price range.
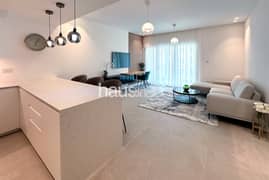
- 1 BED
- |
- 2 BATHS
- |
- 742 SQFT

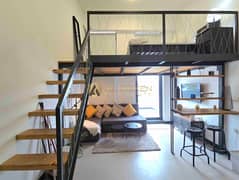
- STUDIO
- |
- 1 BATH
- |
- 424 SQFT
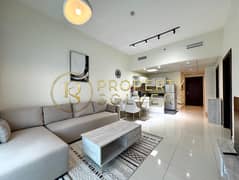
- 1 BED
- |
- 2 BATHS
- |
- 792 SQFT
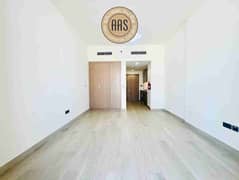
- STUDIO
- |
- 1 BATH
- |
- 471 SQFT
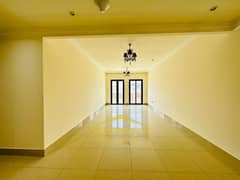
- STUDIO
- |
- 1 BATH
- |
- 378 SQFT
- 2 BEDS
- |
- 3 BATHS
- |
- 1351 SQFT
DAMAC HILLS 2 IS THE MOST SOUGHT-AFTER AREA FOR RENTING AFFORDABLE VILLAS IN DUBAI
POPULAR AREAS TO RENT VILLAS IN DUBAI –BAYUT’S DUBAI RENTAL MARKET REPORT H1 2024
POPULAR AREAS | TRANSACTION PRICE Avg. Yearly RentChange from H2 2023 | 3-BED Avg. Yearly RentChange from H2 2023 | 4-BED Avg. Yearly RentChange from H2 2023 | 5-BED Avg. Yearly RentChange from H2 2023 |
|---|---|---|---|---|
| DAMAC Hills 2 | TRANSACTION PRICE Avg. Yearly RentChange from H2 2023
| 3-BED Avg. Yearly RentChange from H2 2023
| 4-BED Avg. Yearly RentChange from H2 2023
| 5-BED Avg. Yearly RentChange from H2 2023
|
| Mirdif | TRANSACTION PRICE Avg. Yearly RentChange from H2 2023
| 3-BED Avg. Yearly RentChange from H2 2023
| 4-BED Avg. Yearly RentChange from H2 2023
| 5-BED Avg. Yearly RentChange from H2 2023
|
| Dubailand | TRANSACTION PRICE Avg. Yearly RentChange from H2 2023
| 3-BED Avg. Yearly RentChange from H2 2023
| 4-BED Avg. Yearly RentChange from H2 2023
| 5-BED Avg. Yearly RentChange from H2 2023
|
- Tenants on a tighter budget preferred the rental villas in DAMAC Hills 2, Mirdif and Dubailand.
- The rents in these areas witnessed upticks of 1% to 12%, with the 5-bed units in Mirdif and Dubailand reporting the highest increases.
- The overall transaction history for villa rentals in Dubai for these areas showed a similar upward trend in prices.
TOWN SQUARE IS THE MOST SOUGHT-AFTER AREA FOR RENTING MID-TIER VILLAS IN DUBAI
POPULAR AREAS TO RENT MID-TIER VILLAS – DUBAI ANNUAL RENTAL MARKET REPORT FOR H1 2024
POPULAR AREAS | TRANSACTION PRICE Avg. Yearly RentChange from H2 2023 | 3-BED Avg. Yearly RentChange from H2 2023 | 4-BED Avg. Yearly RentChange from H2 2023 | 5-BED Avg. Yearly RentChange from H2 2023 |
|---|---|---|---|---|
| Town Square | TRANSACTION PRICE Avg. Yearly RentChange from H2 2023
| 3-BED Avg. Yearly RentChange from H2 2023
| 4-BED Avg. Yearly RentChange from H2 2023
| 5-BED Avg. Yearly RentChange from H2 2023
|
| Jumeirah Village Circle | TRANSACTION PRICE Avg. Yearly RentChange from H2 2023
| 3-BED Avg. Yearly RentChange from H2 2023
| 4-BED Avg. Yearly RentChange from H2 2023
| 5-BED Avg. Yearly RentChange from H2 2023
|
| The Springs | TRANSACTION PRICE Avg. Yearly RentChange from H2 2023
| 3-BED Avg. Yearly RentChange from H2 2023
| 4-BED Avg. Yearly RentChange from H2 2023
| 5-BED Avg. Yearly RentChange from H2 2023
|
| Not available due to low/no historical inventory or influx of off-plan properties | ||||
- Town Square topped the charts for mid-tier villa rentals during H1 2024. It was closely followed by Jumeirah Village Circle and The Springs.
- These coveted neighbourhoods reported up to 15% appreciation in rental values, given the healthy demand for spacious homes in the market.
- Rental houses in Jumeirah Village Circle experienced the most noticeable surges of 9.25% for 4-bed and 14.7% for 5-bed homes, as the community remains a popular choice with tenants.
DUBAI HILLS ESTATE IS THE MOST POPULAR AREA FOR LUXURY VILLA RENTALS IN DUBAI
POPULAR COMMUNITIES TO RENT LUXURY HOUSES IN DUBAI – BAYUT’S DUBAI RENTAL MARKET REPORT H1 2024
POPULAR AREAS | TRANSACTION PRICE Avg. Yearly RentChange from H2 2023 | 4-BED Avg. Yearly RentChange from H2 2023 | 5-BED Avg. Yearly RentChange from H2 2023 | 6-BED Avg. Yearly RentChange from H2 2023 |
|---|---|---|---|---|
| Dubai Hills Estate | TRANSACTION PRICE Avg. Yearly RentChange from H2 2023
| 4-BED Avg. Yearly RentChange from H2 2023
| 5-BED Avg. Yearly RentChange from H2 2023
| 6-BED Avg. Yearly RentChange from H2 2023
|
| Al Barsha | TRANSACTION PRICE Avg. Yearly RentChange from H2 2023
| 4-BED Avg. Yearly RentChange from H2 2023
| 5-BED Avg. Yearly RentChange from H2 2023
| 6-BED Avg. Yearly RentChange from H2 2023
|
| DAMAC Hills | TRANSACTION PRICE Avg. Yearly RentChange from H2 2023
| 4-BED Avg. Yearly RentChange from H2 2023
| 5-BED Avg. Yearly RentChange from H2 2023
| 6-BED Avg. Yearly RentChange from H2 2023
|
| Not available due to low/no historical inventory or influx of off-plan properties | ||||
- Tenants in search of luxury villas in Dubai, mainly focused their interest on properties in Dubai Hills Estate, Al Barsha and DAMAC Hills.
- Based on the data collected for Dubai rental market report H1 2024, rental costs in these popular villa communities generally increased by between 2% and 27%. However, 4-bed houses in DAMAC Hills and Al Barsha became less expensive by up to 15%.
- The most prominent surge in rents was noticed for 6-bedroom homes in DAMAC Hills, highlighting a greater demand for larger family housing.
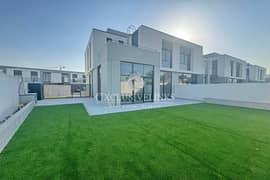
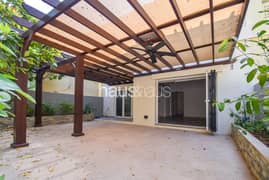
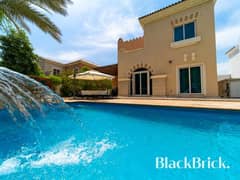
- 4 BEDS
- |
- 3 BATHS
- |
- 4386 SQFT
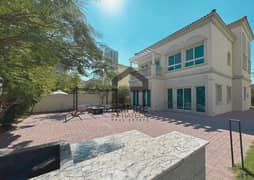
- 5 BEDS
- |
- 4 BATHS
- |
- 3798 SQFT
- 2 BEDS
- |
- 5 BATHS
- |
- 7097 SQFT
Commenting on the findings, Haider Ali Khan, CEO of Bayut and Head of Dubizzle Group MENA said:
“Amidst the global economic slowdown and rising interest rates, we have noticed a pattern of investors worldwide turning to wealth-preserving assets. Contrary to earlier predictions of a slowdown, Dubai’s real estate sector has emerged as a standout choice in this climate, with prices and consumer interest continuing to rise even after a 24-month period of continuous growth.
At such an interesting time in Dubai’s evolution as a globally popular property investment hub, one of the key components that will make a big difference is data-backed transparency in the real estate industry. To support the needs of this growing property-seeking population, we have recently introduced several innovative products on Bayut, including TruEstimate™, a cutting-edge tool developed in collaboration with the Dubai Land Department (DLD), designed to provide precise property valuations, so all our users have the power to make well informed decisions. I think we are at a unique point in Dubai real estate history and I can’t wait to see how we will continue to push boundaries and create even more remarkable success stories. ”
That wraps up our Dubai rental market report for H1 2024. If you are looking into real estate investment opportunities, our H1 2024 Dubai Sales Market Report offers a comprehensive analysis of the Dubai property prices in the most popular areas.
Keep an eye on MyBayut for Bayut property market reports for Abu Dhabi, releasing later this week.
Disclaimer: The average prices in the above Dubai rental property market report (MKTRPTH12024) are based on ready properties advertised by real estate agencies on behalf of their clients on Bayut.com (excluding room share), and is not representative of actual real estate transactions conducted in Dubai, unless specified as based on DLD data.

