Top International Destinations for Business and Leisure
International travel is booming. In 2017, 1.3 billion tourists set foot in another country, a 7 percent increase from the year before. But if the world seems eager for international experiences, the United States has yet to benefit from this trend. Blame the strong dollar or tougher visa vetting procedures, but the numbers are undeniable: As places like Canada and the U.K. welcome tourists in droves, the U.S. is receiving fewer foreign visitors. Even students around the world are shying away, with international enrollment at U.S. colleges and universities dropping 4 percent during the 2017-2018 school year.
We set out to scrutinize international tourism to the U.S., studying where travelers come from, where they visit across the country, and their motives for making the journey. To do so, we analyzed data from the National Travel & Tourism Office, examining arrivals from every corner of the world. Which nations tend to spend big on American soil, or visit primarily for business? Which countries have taken a recent interest in America, and which U.S. cities continue to possess international appeal? For answers to these questions and so many more, keep reading.
Top Tourist Sources

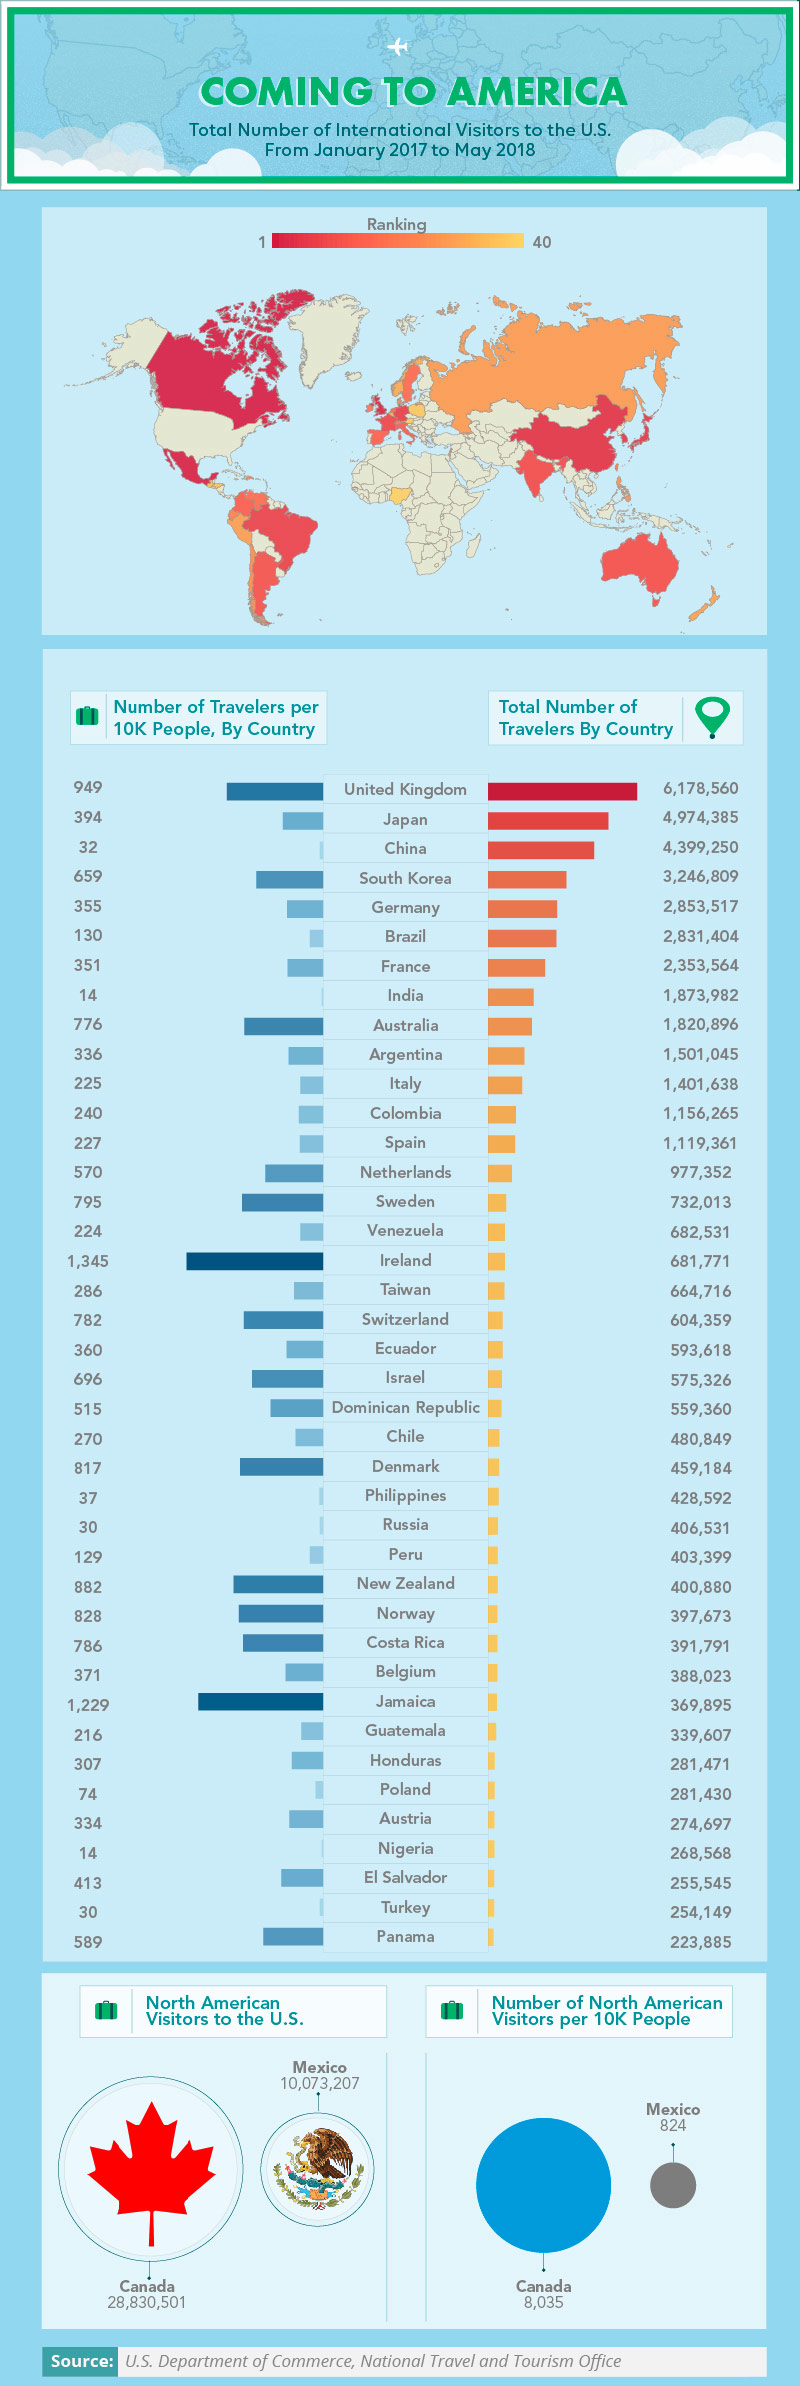
English-speaking nations are major suppliers of tourists to America: Ireland and Jamaica had more than 1,200 visitors to the U.S. for ten thousands, and over 6 million U.K. residents traveled to the U.S. between 2017 and the middle of 2018. Asian tourists also arrived in large numbers, with Japan, China, and South Korea each ranking within the top five for total visitors. China represents a particularly compelling case. While 4,399,250 tourists is a substantial figure, far more are likely to set foot in America in the years to come. While just 7 percent of Chinese citizens have a passport currently, they’re projected to account for a quarter of all global travel by 2030.
Overall, however, America’s neighbors to the north and south supplied far more tourists than other countries. Over 10 million visited from Mexico during the period studied, while nearly 29 million ventured from Canada. While some experts anticipated a “Trump Slump” resulting from recent trade tensions, Canadian tourism to the U.S. has remained relatively robust of late. Conversely, tourism from Mexico has dropped substantially since 2016, a trend that could cost the U.S. more than a billion dollars per year according to some estimates.
Arriving in America

In terms of welcoming foreign tourists, no city surpasses the Big Apple: On average, about 6.8 million foreign visitors arrived in New York City per year between 2015 and 2017. (Another 1.86 million per year also passed through Newark, New Jersey, home to an airport many use to access NYC.) Miami took second place overall with more than 5 million visitors per year on average, followed by California’s twin hubs of Los Angeles and San Francisco. Honolulu rounded out the top five for international arrivals. Thanks to the foreign and domestic interest in Hawaii in recent months, hotel prices have jumped considerably.
While many classic tourist destinations welcomed the greatest number of arrivals overall, certain alternative entry points enjoyed the greatest uptick in traffic. In San Jose, California, international arrivals increased by nearly 121 percent between 2015 and 2017, likely because Mineta San Jose International Airport has dramatically expanded its nonstop routes to and from foreign countries. By contrast, San Antonio, Texas, saw international arrivals dip almost 44 percent, due in part to a decreased flow of visitors from Mexico. Niagara Falls and Philadelphia also suffered substantial declines in international arrivals, welcoming about 25 percent fewer visitors.
Destination Distribution

Beyond initial points of entry, which ultimate destinations do international travelers choose? New York welcomed roughly 20.4 million tourists from 2015 to 2016, outpacing any other state or territory. With 19.2 million, Florida was close behind: Beyond the Sunshine State’s balmy weather and beaches, Orlando’s theme park offerings are a major international draw. California was the only other state to come close, welcoming more than 16 million tourists from abroad. Indeed, international visitors are a big boon to the Golden State’s economy. While foreigners represent just 6 percent of all tourists to the Golden State, they account for 22 percent of total tourism spending.
New Jersey enjoyed the largest surge in international visits during the period studied, an interesting change for a state traditionally focused on attracting domestic tourism dollars during the summer months. At the other end of the spectrum, Washington saw a 14 percent slump, although overall travel to Seattle continues to grow steadily. Michigan witnessed a similar disparity. While state officials say their aggressive “Pure Michigan” marketing campaign has driven strong domestic tourism in recent years, attracting international visitors has proven relatively challenging.
Big Spenders by Region of Origin

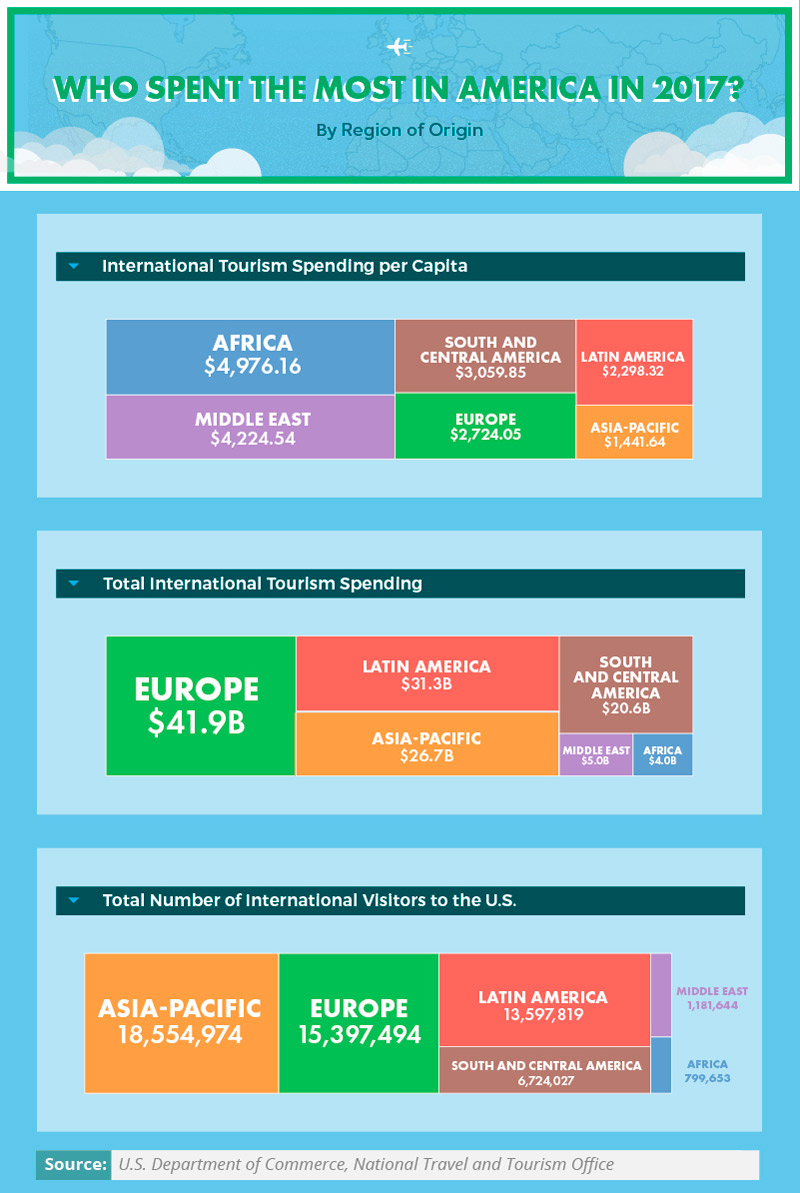
If the Asia-Pacific region accounts for more visitors to the U.S. than any other part of the world, other areas still lead the way in spending. European travelers shelled out $41.9 billion on American soil in 2017, and tourists from Latin America spent $31.3 billion that year. In terms of per capita spending, however, African and Middle Eastern tourists far outpaced other regions.
This trend could reflect the relative wealth of those who come to the U.S. from these places: Africa and the Middle East experience tremendous income inequality, suggesting only a limited number of wealthy people can afford to visit America at all. No matter which part of the world they hail from, however, international tourists tend to spend far more than Americans do. Among visitors to New York City, for example, international tourists spend four times as much as travelers from other parts of the U.S.
Intentions of International Travelers

From January 2017 to May 2018, the U.K., Japan, and Germany supplied the greatest number of business travelers to the U.S. These countries number among America’s top trading partners, and citizens of these nations are eligible for the Visa Waiver Program, allowing them to travel on business for 90 days without prior approval from the State Department. China, America’s largest trading partner, does not belong to the list of nations with Visa Waiver privileges – a fact that surely contributes to its relatively modest business travel numbers. Chinese citizens obtained the most student visas by far, however, with more than three times as many as any other country.

We also considered the percentage of visitors from each country traveling for business, pleasure, and educational reasons. Among tourists from several Latin American countries, for example, roughly 9 in 10 visitors traveled for pleasure. China and India were outliers in terms of student travelers, with a strikingly large percentage of travelers from both countries pursuing educational opportunities. Conversely, European nations had some of the highest proportions of business travelers: At least 23 percent of visitors from Poland, Germany, Belgium, and the Netherlands came to the U.S. for reasons related to work.
Peak Travel Times and Prices

Our findings suggest that the number of international visitors and average passenger airfare is inversely correlated: An increase in arrivals typically coincides with a decline in ticket prices. One might interpret these results as simple economics at work, with better deals tempting travelers to head to America. Bear in mind, however, shorter international flights from neighboring countries tend to be considerably cheaper and more common than longer journeys across the globe. For example, an influx of Canadian tourists in the summer months could simultaneously lift the number of international visitors and drive down the average ticket price for international arrivals.
Overall, cold months seemed to stem the tide of international travelers considerably. The four slowest months for visitors from abroad were November, January, February, and March. Conversely, July saw 6 million international tourists land in America, and August brought even more. This seasonal disparity may actually grow in the coming years, as more American cities – including some with fearsome winters – compete for the dollars of international visitors. The hospitality industries in Boston and Milwaukee, for example, are eager to entice Chinese tourists in the coming years, but they may have more luck doing so in the warmer months.
Global Events, Economic Impact

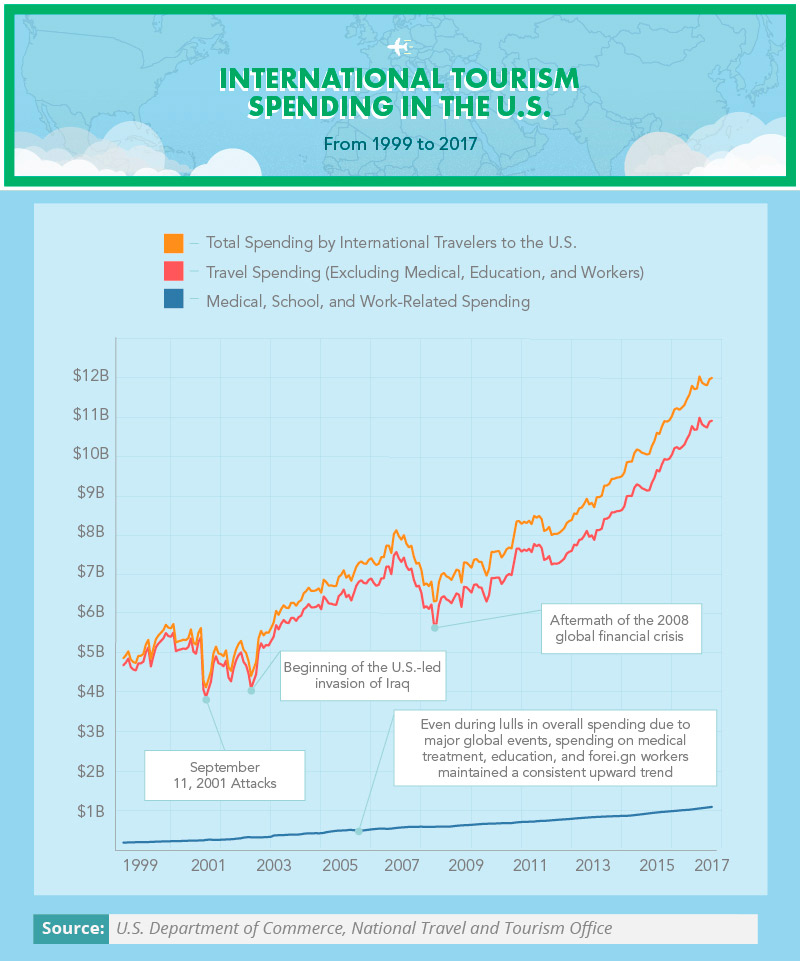
International tourism to America is not immune to global crises. Following the events of September 11, 2001, total spending by international travelers sagged significantly – an important dimension of the estimated $3.3 trillion economic impact of the attacks. Likewise, the global financial crisis of 2008 sent international tourist spending plunging, and it rebounded only incrementally over the next several years. This finding may strike some as surprising: Economic downturns can sometimes attract visitors from abroad looking for a deal, as has recently occurred in the U.K. following the so-called “Brexit” referendum. But because the ramifications of the 2008 crisis extended across the world, international travelers were also spending-averse during that difficult period.
If overall international tourist spending has varied as global events unfold, certain sectors seemed insulated from market changes. Medical, educational, and work-related spending grew consistently between 1999 and 2017, rising on a slow but sustainable trajectory. Health care expenditures likely relate to the availability and quality of care in nations where medical resources have not kept pace with income and population growth. In China, for example, doctors are often hopelessly overburdened and deeply underqualified – with just one general practitioner for every 6,666 people.
Expenditures and Arrivals Over Time
When we consider tourism to America from specific regions of the world, we find interesting exceptions to broader global narratives. In 2009, for example, visitors from Africa and the Middle East spent more in America than the year before, whereas tourists from every other part of the world spent less as the financial crisis unfolded. Moreover, while the general trend was an upswing in spending and arrivals over time, tourism from some parts of the world surged spectacularly. Between 2008 and 2016, the number of annual arrivals from the Asia-Pacific region increased by roughly 6 million.
While the statistics from this period present substantial growth in tourism revenues from each region, 2016 offered evidence of decline as well. That year, tourist arrivals from all but one part of the world sagged slightly. The exception was the Asia-Pacific region, and even there, annual visitor growth was smaller than the year prior. In response to declines in international visits, tourism and hospitality groups have lobbied for a series of policy changes to facilitate travel from abroad. Their proposed measures include expanding the Visa Waiver Program to cover more countries, expediting arduous customs processes, and revitalizing government-funded marketing efforts abroad.
Great Expectations: The Middle East

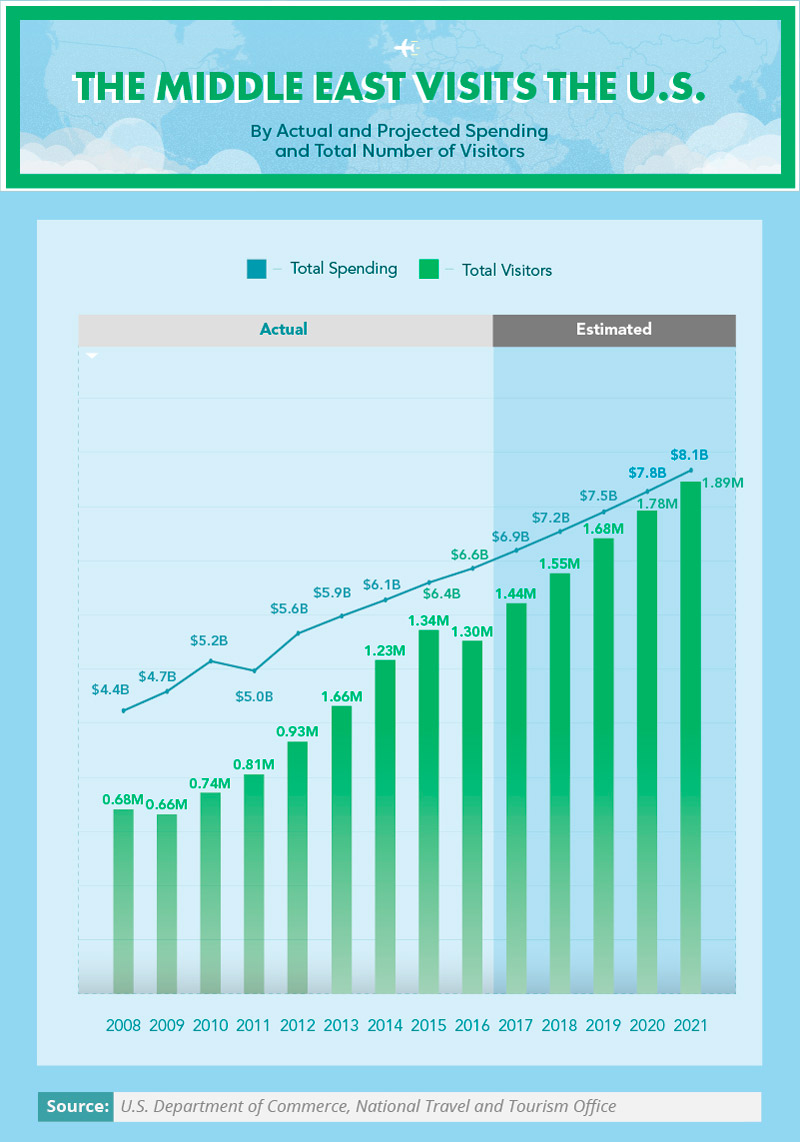
If 2016 brought a slight decline in tourist arrivals from the Middle East, current projections suggest that year will be an aberration. In fact, visitor figures from the region are expected to climb significantly, reaching 1.9 million people by 2021. Moreover, spending by Middle Eastern visitors is predicted to surpass $8.1 billion that year. This growing travel interest seems reciprocal: American tourists are heading to the Middle East in greater numbers, especially to iconic cities such as Dubai.
Of course, the dynamics of tourism from the Middle East can be complicated by geopolitical events, adding a degree of uncertainty to these projections. According to some travel industry analysts, the Trump administration’s proposed ban on travel from several Muslim-majority countries could result in billions of dollars of lost tourist revenue. Additionally, some nation’s travel patterns are particularly prone to variability: Experts note that Saudi arrivals to the U.S. declined substantially in 2017 but bounced back the following year.
Living Well – At Home or Abroad
Our findings indicate a rapidly shifting landscape for international visitors to the United States: As interest in America fades in some corners of the world, tourism surges from other regions. And while international visitors arrive with a range of hopes and motives in mind, their various pursuits contribute to a broader outcome – an injection of cash into the American economy. The tastes of travelers across the world will continue to evolve, shaped by global trends and national circumstances. While America will likely remain a top international destination in the coming decades, the experiences tourists seek there will certainly change in time.
The U.S. is not alone in navigating the ever-changing needs of foreign visitors. As the top real estate resource for properties throughout the United Arab Emirates, Bayut helps folks from around the world get settled in beautiful new homes – whether one is looking at villas or apartments for sale in Dubai or considering villas or apartments for rent in Dubai. If you or someone you know needs the perfect place to call your own in the UAE, you won’t want to miss our listings and be sure to check out apartments for sale in Dubai Marina and Downtown Dubai or gorgeous villas for sale in Arabian Ranches and Palm Jumeirah. With our help, you’ll feel like a local, not a tourist.
Methodology
Data for this project were obtained from several data sets released by the U.S. National Tourism and Travel Office. Data were taken from the I-94 Program: 2015-2018 Monthly-Quarterly-Annual Arrivals Data, International Visitation in the United States Market Research, and the International Travel Receipts and Payments Program. To calculate estimated projections for Middle East tourism from 2017 to 2021, we calculated the average rate of change for visitors and spending from 2008 to 2016 and applied this as a scaling factor to project the currently unreleased/unavailable data.
Sources
- https://www.cnbc.com/2018/01/17/international-tourism-is-booming-but-not-to-the-us.html
- https://www.reuters.com/article/us-usa-immigration-visa/trump-administration-approves-tougher-visa-vetting-including-social-media-checks-idUSKBN18R3F8
- https://www.newsday.com/opinion/commentary/us-tourism-summer-2018-1.19212668
- http://tinet.ita.doc.gov/outreachpages/inbound.general_information.inbound_overview.asp
- https://www.telegraph.co.uk/travel/comment/rise-of-the-chinese-tourist/
- https://www.cbsnews.com/news/canadian-tourists-still-flocking-to-the-u-s-so-far/
- https://www.latimes.com/world/mexico-americas/la-fg-mexico-us-travel-20170414-story.html
- https://www.cnn.com/travel/article/which-nyc-airport-should-i-fly-into/index.html
- https://www.latimes.com/travel/hawaii/la-tr-hawaii-hotel-prices-incease-as-does-tourism-20180207-story.html
- https://www.bizjournals.com/sanjose/news/2018/08/01/seven-reasons-business-travelers-are-choosing-san.html
- https://www.expressnews.com/business/local/article/Trump-effect-on-international-tourism-San-12722951.php
- https://theculturetrip.com/north-america/usa/florida/articles/how-orlando-became-the-theme-park-capital-of-the-world/
- https://www.ocregister.com/2017/03/02/would-17-million-tourists-skip-california/
- https://www.nj.com/politics/index.ssf/2017/03/garden_state_tourists_spent_44b_in_2016.html
- https://www.seattletimes.com/business/economy/a-banner-year-for-tourism-in-seattle-and-king-county/
- https://www.crainsdetroit.com/article/20171015/news/642136/as-economy-improves-so-does-michigan-tourism
- https://www.brookings.edu/blog/africa-in-focus/2017/09/28/figures-of-the-week-diverging-trends-on-income-inequality-in-sub-saharan-africa/
- https://thearabweekly.com/middle-east-leads-world-income-inequality
- https://www.travelandleisure.com/travel-tips/travel-trends/foreign-tourists-spending
- http://fortune.com/2018/03/07/biggest-us-trade-partners/
- https://travel.state.gov/content/travel/en/us-visas/tourism-visit/visa-waiver-program.html
- http://www.traveller.com.au/why-australia-is-bucking-the-trump-slump-trend-gz3027
- https://globalnews.ca/news/4334752/quebecers-still-pouring-into-the-united-states-for-summer-holidays/
- https://www.jsonline.com/story/money/business/2017/03/31/more-us-cities-aim-make-chinese-travelers-feel-home/99886106/
- https://www.forbes.com/sites/edfuller/2017/07/12/tourism-remains-resilient-in-face-of-global-terrorism/#21769702765e
- https://www.theguardian.com/business/2017/nov/17/weak-pound-record-number-tourists-uk-august
- https://www.cnbc.com/2018/10/01/chinas-health-care-crisis-lines-before-dawn-violence-and-no-trust.html
- https://www.washingtonexaminer.com/business-coalition-wants-to-make-visiting-us-easier-to-stave-off-tourism-collapse
- https://www.vogue.com/article/middle-east-travel-on-the-rise
- https://www.usatoday.com/story/news/world/2017/03/29/trumps-travel-ban-could-cost-18b-us-tourism-travel-analysts-say/99708758/
- http://www.arabnews.com/node/1271241/saudi-arabia
- https://www.washingtonpost.com/news/worldviews/wp/2018/03/22/fewer-tourists-are-visiting-the-u-s-under-trump-canadians-didnt-get-the-memo/?utm_term=.13095d6c19cd
Fair Use Statement
We hope this content will conduct some international travel of its own, reaching readers in every corner of the globe. Help us by sharing this project with your friends and followers (for noncommercial purposes, of course). When you do, please include a link to this page to credit our team appropriately.


