Bayut’s Abu Dhabi Q3 Rental Property Market Report 2023
- Top Neighbourhoods
- Affordable Apartment Rentals
- Luxury Apartment Rentals
- Affordable Villa Rentals
- Luxury Villa Rentals
As we near the end of 2023, it’s very evident that the Abu Dhabi real estate market is continuing to thrive. This Bayut Abu Dhabi Q3 rental property market report 2023 delves into the trends that have dominated the capital’s popular residential areas over the past three months. A quick look at the trends observed for Bayut’s Abu Dhabi Q3 rental real estate market report 2023 reveals that:
- The affordable rental market saw a noteworthy increase of nearly 9% for specific bed types, potentially indicating a growing demand for budget-friendly accommodation.
- Luxury rental prices increased by up to 10%, hinting at a flourishing high-end rental market.
To ensure a comprehensive Abu Dhabi property market analysis, we have compared the average rental rates for apartments and villas from Q2 2023 to Q3 2023 (excluding room share).
Popular areas for rental apartments and villas are segmented into ‘Affordable’ and ‘Luxury’ categories to provide a more tailored view of the Abu Dhabi real estate market.
TOP NEIGHBOURHOODS FOR RENTING VILLAS AND APARTMENTS IN Q3 2023
As per the data from Bayut, the Abu Dhabi real estate market in Q3 of 2023 has experienced a consistent need for spacious residences in well-established neighbourhoods. As a result, the rental prices for premium villas and apartments have surged. Correspondingly, the affordable sector also experienced price upticks.
The Abu Dhabi property market report Q3 2023 indicates that tenants with a tighter budget preferred:
- Khalifa City
- Al Khalidiyah
- Mohammed Bin Zayed City
- Madinat Al Riyadh
Those intending to buy upscale properties showed an inclination towards the well-established communities of:
- Al Reem Island
- Al Raha Beach
- Al Raha Gardens
- Yas Island
In the following sections, we take a closer look at the rental trends reflected in the Abu Dhabi Q3 property market report 2023.
KHALIFA CITY IS THE MOST POPULAR AREA TO RENT AFFORDABLE FLATS IN ABU DHABI
RENTAL PRICES FOR AFFORDABLE APARTMENTS IN POPULAR AREAS – ABU DHABI PROPERTY MARKET REPORT Q3 2023
POPULAR AREAS | STUDIO Avg. Yearly RentChange from Q2 2023 | 1-BED Avg. Yearly RentChange from Q2 2023 | 2-BED Avg. Yearly RentChange from Q2 2023 |
|---|---|---|---|
| Khalifa City | STUDIO Avg. Yearly RentChange from Q2 2023
| 1-BED Avg. Yearly RentChange from Q2 2023
| 2-BED Avg. Yearly RentChange from Q2 2023
|
| Al Khalidiyah | STUDIO Avg. Yearly RentChange from Q2 2023
| 1-BED Avg. Yearly RentChange from Q2 2023
| 2-BED Avg. Yearly RentChange from Q2 2023
|
| Al Muroor | STUDIO Avg. Yearly RentChange from Q2 2023
| 1-BED Avg. Yearly RentChange from Q2 2023
| 2-BED Avg. Yearly RentChange from Q2 2023
|
| Al Shamkha | STUDIO Avg. Yearly RentChange from Q2 2023
| 1-BED Avg. Yearly RentChange from Q2 2023
| 2-BED Avg. Yearly RentChange from Q2 2023
|
| Hamdan Street | STUDIO Avg. Yearly RentChange from Q2 2023
| 1-BED Avg. Yearly RentChange from Q2 2023
| 2-BED Avg. Yearly RentChange from Q2 2023
|
As per the Abu Dhabi Q3 rental property market report 2023, Khalifa City is currently the most popular area for those searching for affordable flats to rent in Abu Dhabi:
- In the third quarter of 2023, prices for apartments for rent in Khalifa City remained constant for studios and 1-bed units. Prices for 2-bedroom rental flats increased by 1.16%.
- On average, tenants paid AED 28k for studio rentals, AED 42k for 1-bedroom flats and AED 63k for 2-bedroom apartments for rent in Khalifa City.
Al Khalidiyah continued to be a favourite among those searching for affordable rental apartments in Abu Dhabi:
- Abu Dhabi rental property prices 2023 Q3 for studio and 2-bed apartments in Al Khalidiyah declined by 0.75% and 1.44%, respectively. However, asking rents for 1-bed flats increased by 5.66%.
- The prices of studio flats for rent in Al Khalidiyah averaged at AED 29k. 1 and 2-bed flats for rent in Al Khalidiyah were priced at AED 55k and AED 64k, respectively.
Al Muroor secured its spot as the third-most-popular area to rent affordable apartments in the emirate:
- The rental prices of studios in Al Muroor have gone up by 9.07%. However, the prices of 1-bedroom rental units have remained unchanged. Meanwhile, 2-bedroom apartments have experienced a 4.15% increase in rental prices.
- The average Q3 Abu Dhabi rental property prices 2023 for studios for rent in Al Muroor were AED 34k, while 1-bedroom and 2-bedroom apartments in the same area were priced at AED 42k and AED 56k, respectively.
According to our Abu Dhabi Q3 property market report 2023, many tenants also showed preference towards affordable apartments in the following areas:
- Al Shamkha
- Hamdan Street
As per the Abu Dhabi property market analysis, the asking rents in these areas generally increased from between 1.07% and 5.21%. However, studio and 1-bed apartments in Hamdan Street became cheaper by 2.65% and 3.03%, respectively.
AL REEM ISLAND REMAINS THE TOP CHOICE FOR LUXURY APARTMENT RENTALS IN ABU DHABI
POPULAR AREAS TO RENT HIGH-END APARTMENTS – ABU DHABI Q3 REAL ESTATE MARKET REPORT 2023
POPULAR AREAS | 1-BED Avg. Yearly RentChange from Q2 2023 | 2-BED Avg. Yearly RentChange from Q2 2023 | 3-BED Avg. Yearly RentChange from Q2 2023 |
|---|---|---|---|
| Al Reem Island | 1-BED Avg. Yearly RentChange from Q2 2023
| 2-BED Avg. Yearly RentChange from Q2 2023
| 3-BED Avg. Yearly RentChange from Q2 2023
|
| Al Raha Beach | 1-BED Avg. Yearly RentChange from Q2 2023
| 2-BED Avg. Yearly RentChange from Q2 2023
| 3-BED Avg. Yearly RentChange from Q2 2023
|
| Corniche Area | 1-BED Avg. Yearly RentChange from Q2 2023
| 2-BED Avg. Yearly RentChange from Q2 2023
| 3-BED Avg. Yearly RentChange from Q2 2023
|
| Yas Island | 1-BED Avg. Yearly RentChange from Q2 2023
| 2-BED Avg. Yearly RentChange from Q2 2023
| 3-BED Avg. Yearly RentChange from Q2 2023
|
| Corniche Road | 1-BED Avg. Yearly RentChange from Q2 2023
| 2-BED Avg. Yearly RentChange from Q2 2023
| 3-BED Avg. Yearly RentChange from Q2 2023
|
Al Reem Island remained the preferred destination for those seeking an unparalleled living experience and luxurious apartment rentals in Abu Dhabi:
- The 1, 2 and 3-bedroom apartments for rent on Al Reem Island showed an uptrend during Q3 2023, with average prices increasing by 1.87%, 2.93%, and 2.62% for each bed type, respectively.
- On average, tenants paid AED 60k for 1-bed units, AED 90k for 2-bed flats and AED 130k for 3-bed rental apartments in Al Reem Island this quarter.
Al Raha Beach was another popular ‘waterfront’ spot for luxury apartment renters in the UAE capital as per the Abu Dhabi Q3 rental real estate market report 2023:
- During Q3 2023, the average rental cost of 3-bed units in Al Raha Beach decreased by 2.57%, whereas the average prices of 1-bedroom and 2-bedroom flats for rent in Al Raha Beach increased by 1.24% and 0.77%, respectively.
- Apartment rentals in Al Raha Beach come at a premium price, with 1-bedroom flats averaging at AED 63k, 2-bedroom apartments priced at AED 98k and 3-bedroom units available for AED 153k.
Tenants also focused on Corniche Area for luxury apartments in the third quarter of 2023:
- As per the Abu Dhabi Q3 real estate market report 2023 data, the average rent for apartments in Corniche Area experienced fluctuations across multiple categories. Rents for 1-bed flats increased by 7.05%. However, the asking rents for 2 and 3-bed apartments declined by 0.94% and 4.35%, respectively.
- 1-bed flats for rent in Corniche Area cost around AED 78k, whereas 2 and 3-bed apartments in the area were priced at AED 107k and AED 125k on average, respectively.
Areas with an impressive inventory of luxury apartments popular with tenants in Q3 2023 also included:
- Yas Island
- Corniche Road
The rents for flats in these areas increased from between 1% and 10%, with 1-bed units in Yas Island becoming more affordable by 3.47%.

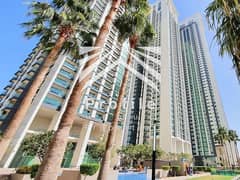
- 1 BED
- |
- 2 BATHS
- |
- 801 SQFT
- 1 BED
- |
- 2 BATHS
- |
- 860 SQFT
- 3 BEDS
- |
- 4 BATHS
- |
- 2169 SQFT
- 3 BEDS
- |
- 4 BATHS
- |
- 2090 SQFT
- 3 BEDS
- |
- 4 BATHS
- |
- 1775 SQFT

- 3 BEDS
- |
- 5 BATHS
- |
- 2356 SQFT
MOHAMMED BIN ZAYED CITY IS THE MOST POPULAR AREA FOR RENTING AFFORDABLE VILLAS IN ABU DHABI
MOST SOUGHT-AFTER AREAS TO RENT AFFORDABLE VILLAS IN ABU DHABI – BAYUT Q3 2023 ABU DHABI MARKET REPORT ANALYSIS
POPULAR AREAS | 3-BED Avg. Yearly RentChange from Q2 2023 | 4-BED Avg. Yearly RentChange from Q2 2023 | 5-BED Avg. Yearly RentChange from Q2 2023 |
|---|---|---|---|
| Mohammed Bin Zayed City | 3-BED Avg. Yearly RentChange from Q2 2023
| 4-BED Avg. Yearly RentChange from Q2 2023
| 5-BED Avg. Yearly RentChange from Q2 2023
|
| Khalifa City | 3-BED Avg. Yearly RentChange from Q2 2023
| 4-BED Avg. Yearly RentChange from Q2 2023
| 5-BED Avg. Yearly RentChange from Q2 2023
|
| Madinat Al Riyadh | 3-BED Avg. Yearly RentChange from Q2 2023
| 4-BED Avg. Yearly RentChange from Q2 2023
| 5-BED Avg. Yearly RentChange from Q2 2023
|
| Al Reef | 3-BED Avg. Yearly RentChange from Q2 2023
| 4-BED Avg. Yearly RentChange from Q2 2023
| 5-BED Avg. Yearly RentChange from Q2 2023
|
| Shakhbout City | 3-BED Avg. Yearly RentChange from Q2 2023
| 4-BED Avg. Yearly RentChange from Q2 2023
| 5-BED Avg. Yearly RentChange from Q2 2023
|
According to Bayut’s Abu Dhabi Q3 rental property market report 2023, Mohammed Bin Zayed City (MBZ City) was the top choice for tenants seeking budget-friendly villas:
- As for villas in Mohammed Bin Zayed City, 3-bed and 5-bed houses for rent in MBZ City experienced surges of 6.44% and 2.98%, respectively. However, rents for 4-bed villas in the area remained unchanged.
- On average, 3-bed villas for rent in Mohammed Bin Zayed City were priced at AED 103k per year. The 4-bed villas averaged at AED 132k and 5-bed villas were available for AED 154k.
- 7 BEDS
- |
- 7 BATHS
- |
- 6907 SQFT
The family-friendly neighbourhood of Khalifa City continued to be a popular choice for budget-conscious tenants looking for spacious villas in Abu Dhabi:
- During Q3 2023, the average cost of villas for rent in Khalifa City experienced moderate declines of 3.70% and 2.15% for 3 and 4-bed categories. The 5-bed rental villas in Khalifa City became marginally more expensive by 0.84%.
- Average rents for villas in Khalifa City in Q3 2023 were recorded as follows: AED 153k for 3-bedroom units, AED 155k for 4-bedroom houses and AED 172k for 5-bedroom units.
According to our Q3 2023 rental property market report for Abu Dhabi, there was a growing interest among potential tenants in affordable homes in Madinat Al Riyadh:
- Villas for rent in Madinat Al Riyadh witnessed moderate price increases of 2.21% and 1.41% in Q3 2023 in the 3 and 5-bed categories. The 4-bed houses in the same area experienced a minor 1.13% decline in rental prices.
- On average 3-bed rental villas in Madinat Al Riyadh were priced at AED 113k. The average rental price of 4 and 5-bedroom villas in the neighbourhood stood at AED 140k and AED 157k, respectively.
As per the current rental market trends in Abu Dhabi, tenants also showed preference for budget-friendly villas in the following areas during Q3 2023:
- Al Reef
- Shakhbout City
Average rental costs for villas in these areas increased by up to 3.66%. Price decreases of 2.42% were recorded for 5-bed houses in Shakhbout City.
AL RAHA GARDENS IS THE MOST POPULAR AREA FOR RENTING LUXURY VILLAS IN ABU DHABI
MOST POPULAR AREAS TO RENT LUXURY VILLAS – ABU DHABI PROPERTY MARKET REPORT 2023
POPULAR AREAS | 4-BED Avg. Yearly RentChange from Q2 2023 | 5-BED Avg. Yearly RentChange from Q2 2023 | 6-BED Avg. Yearly RentChange from Q2 2023 |
|---|---|---|---|
| Al Raha Gardens | 4-BED Avg. Yearly RentChange from Q2 2023
| 5-BED Avg. Yearly RentChange from Q2 2023
| 6-BED Avg. Yearly RentChange from Q2 2023
|
| Yas Island | 4-BED Avg. Yearly RentChange from Q2 2023
| 5-BED Avg. Yearly RentChange from Q2 2023
| 6-BED Avg. Yearly RentChange from Q2 2023
|
| Al Mushrif | 4-BED Avg. Yearly RentChange from Q2 2023
| 5-BED Avg. Yearly RentChange from Q2 2023
| 6-BED Avg. Yearly RentChange from Q2 2023
|
| Al Reef | 4-BED Avg. Yearly RentChange from Q2 2023
| 5-BED Avg. Yearly RentChange from Q2 2023
| 6-BED Avg. Yearly RentChange from Q2 2023
|
| Al Salam Street | 4-BED Avg. Yearly RentChange from Q2 2023
| 5-BED Avg. Yearly RentChange from Q2 2023
| 6-BED Avg. Yearly RentChange from Q2 2023
|
| Not available due to low/no historical inventory or influx of off-plan properties | |||
Bayut’s Abu Dhabi Q3 rental real estate market report 2023 revealed that Al Raha Gardens was the most popular location for renting luxury villas in the emirate:
- As per the Abu Dhabi property market analysis, villas for rent in Al Raha Gardens, particularly 5-bed units, became cheaper by 6.15% during the third quarter of 2023. The 4-bed units became slightly more expensive, with an increase of 1.17% in the rental prices.
- The asking rent for a 4-bed villa in Al Raha Gardens during Q3 2023 was AED 168k, on average. Rents for a 5-bed villa in Al Raha Gardens averaged at AED 224k.
Luxury villas on Yas Island were in high demand among potential tenants, according to the Abu Dhabi property market report Q3 2023. Yas Island villas offer an unparalleled blend of opulent living, stunning architecture, and world-class amenities to residents:
- The average yearly rent of Yas Island villas increased by 4.59% and 5.12% for 4 and 5-bed villas, respectively.
- Tenants considering moving to houses for rent in Yas Island can expect to pay AED 348k for 4-bed houses and AED 344k for 5-bed rental villas in Yas Island.
In Bayut’s Q3 2023 Abu Dhabi real estate market report, Al Mushrif has also been identified as an area of interest for tenants seeking high-end rental villas:
- Based on recent data, the average rents for 4-bedroom villas in Al Mushrif have decreased by 4.59%. However, the rents for 5 and 6-bedroom villas have increased by 1.53% and 3.27%, respectively.
- In Q3 2023, the asking rent for 4-bedroom villas in Al Mushrif was AED 161k, while the rents for 5 and 6-bed houses were AED 208k and AED 199k, respectively.
Al Reef and Al Salam Street were the other two highly sought-after destinations for those looking to rent luxurious villas in Abu Dhabi. Rental costs in these areas increased by up to 5% for most bed types.
- 2 BEDS
- |
- 3 BATHS
- |
- 1204 SQFT
- 5 BEDS
- |
- 5 BATHS
- |
- 2941 SQFT

- 4 BEDS
- |
- 5 BATHS
- |
- 6771 SQFT
That marks the conclusion of the Abu Dhabi Q3 rental property market report 2023. If you’re interested in gaining a deeper understanding of the capital city’s prevailing real estate market conditions from an investment perspective, Bayut’s Q3 sales market report for Abu Dhabi 2023 makes for essential reading.
Discover the latest insights on rental trends in the neighbouring emirate by checking out the Dubai Q3 2023 rental market report.
To stay ahead of the competition and make informed decisions regarding real estate investments, don’t forget to subscribe to MyBayut!
Disclaimer: The average prices in the above Abu Dhabi rental property market report (MKTRPTQ32023) are based on ready properties advertised by real estate agencies on behalf of their clients on Bayut.com (excluding room share), and is not representative of actual real estate transactions conducted in Abu Dhabi.


