Bayut & dubizzle’s Q3 2021 Abu Dhabi rental market report: Prices continue to cater to a tenant-friendly market in the capital
As the third quarter of 2021 draws to a close, it is time to analyse how Abu Dhabi’s real estate market has performed during the last three months. As per our evaluation of Abu Dhabi’s real estate market, Q3 2021 has seen the capital exhibiting signs of greater stability in the affordable segment, while prices in the luxury segment have continued their upward trajectory.
Our Abu Dhabi rental property market report has revealed a list of areas that have drawn attention among tenants for both affordable and upscale living. As per the report, tenants have been inclined towards family-friendly suburbs like Khalifa City A and Mohammed Bin Zayed City for reasonably-priced properties. For renting upscale villas or apartments, tenants have turned towards waterfront communities such as Al Reem Island, Saadiyat Island and Al Raha Beach in Q3 2021.
To give you an in-depth insight into the emirate’s rental prices, Bayut & dubizzle’s combined Abu Dhabi Q3 rental property market report compares average rental prices for villas and apartments from Q3 2021 to Q2 2021 (excluding room share). We have further segmented popular areas into ‘Affordable’ and ‘Luxury’ sections for ease of your understanding.
Without further ado, let’s take a look at Abu Dhabi rental property prices and trends as revealed in our Q3 2021 Abu Dhabi market report.
KHALIFA CITY A CONTINUES TO BE THE TOP CHOICE FOR RENTING AFFORDABLE APARTMENTS
RENTAL PRICES IN ABU DHABI FOR AFFORDABLE APARTMENTS IN POPULAR AREAS – BAYUT & DUBIZZLE Q3 REAL ESTATE MARKET REPORT
POPULAR AREAS | STUDIOS Avg. Yearly RentChange from Q2 2021 | 1-BED Avg. Yearly RentChange from Q2 2021 | 2-BED Avg. Yearly RentChange from Q2 2021 |
|---|---|---|---|
| Khalifa City A | STUDIOS Avg. Yearly RentChange from Q2 2021
| 1-BED Avg. Yearly RentChange from Q2 2021
| 2-BED Avg. Yearly RentChange from Q2 2021
|
| Al Khalidiyah | STUDIOS Avg. Yearly RentChange from Q2 2021
| 1-BED Avg. Yearly RentChange from Q2 2021
| 2-BED Avg. Yearly RentChange from Q2 2021
|
| Al Muroor | STUDIOS Avg. Yearly RentChange from Q2 2021
| 1-BED Avg. Yearly RentChange from Q2 2021
| 2-BED Avg. Yearly RentChange from Q2 2021
|
| Hamdan Street | STUDIOS Avg. Yearly RentChange from Q2 2021
| 1-BED Avg. Yearly RentChange from Q2 2021
| 2-BED Avg. Yearly RentChange from Q2 2021
|
| Tourist Club Area (TCA) | STUDIOS Avg. Yearly RentChange from Q2 2021
| 1-BED Avg. Yearly RentChange from Q2 2021
| 2-BED Avg. Yearly RentChange from Q2 2021
|
In Q3 2021, Khalifa City A has been the most popular area for renting affordable apartments in Abu Dhabi. The continued popularity of the area could be attributed to its proximity to Dubai and easy access to both basic and recreational amenities.
The average yearly rent for studios in Khalifa City A has remained constant in Q3 2021, averaging at AED 27k, whereas the prices for 1-bed apartments for rent in Khalifa City A have increased by 0.47% to AED 42k per annum. When it comes to bigger units, the average rental prices for 2-bed apartments in the community have reduced by 2.43% to AED 62k in the third quarter of 2021.
The centrally located Al Khalidiyah area in Abu Dhabi has been the second most popular choice for renting apartments among price-conscious tenants in the capital.
The asking rents in Al Khalidiyah witnessed a moderate decline between 6.5% and 7.4%, on average. The cost of studios for rent in Al Khalidiyah has sustained at AED 29k per annum. For 1 and 2-bed apartments, tenants can expect to pay AED 51k and AED 66k on average, respectively.
The data presented in Abu Dhabi’s quarterly market report for renting cheap flats in the emirate also reflects users inclination towards family-centric areas like Al Muroor, Hamdan Street and Tourist Club Area (TCA) in Q3 2021.
AL REEM ISLAND RETAINS POPULARITY FOR LUXURY APARTMENT RENTALS IN ABU DHABI
TOP AREAS TO RENT HIGH-END APARTMENTS IN ABU DHABI – BAYUT & DUBIZZLE Q3 2021 ABU DHABI MARKET REPORT
POPULAR AREAS | 1-BED Avg. Yearly RentChange from Q2 2021 | 2-BED Avg. Yearly RentChange from Q2 2021 | 3-BED Avg. Yearly RentChange from Q2 2021 |
|---|---|---|---|
| Al Reem Island | 1-BED Avg. Yearly RentChange from Q2 2021
| 2-BED Avg. Yearly RentChange from Q2 2021
| 3-BED Avg. Yearly RentChange from Q2 2021
|
| Al Raha Beach | 1-BED Avg. Yearly RentChange from Q2 2021
| 2-BED Avg. Yearly RentChange from Q2 2021
| 3-BED Avg. Yearly RentChange from Q2 2021
|
| Corniche Area | 1-BED Avg. Yearly RentChange from Q2 2021
| 2-BED Avg. Yearly RentChange from Q2 2021
| 3-BED Avg. Yearly RentChange from Q2 2021
|
| Corniche Road | 1-BED Avg. Yearly RentChange from Q2 2021
| 2-BED Avg. Yearly RentChange from Q2 2021
| 3-BED Avg. Yearly RentChange from Q2 2021
|
| Saadiyat Island | 1-BED Avg. Yearly RentChange from Q2 2021
| 2-BED Avg. Yearly RentChange from Q2 2021
| 3-BED Avg. Yearly RentChange from Q2 2021
|
Al Reem Island has once again emerged as the most tenant-friendly area for luxury apartments in Abu Dhabi thanks to its waterfront lifestyle and high-end amenities. The asking rents for apartments in Al Reem Island have seen minor changes. 1-bed and 2-bed apartments in Al Reem Island have averaged at AED 57k and AED 84k, dipping by a negligible 0.7%. Rents for 3-bedroom flats in Al Reem Island have remained constant at AED 125k.
Another waterfront area that has continued to be a firm favourite with tenants in Abu Dhabi is Al Raha Beach. The rents in Al Raha Beach have seen moderate appreciation in Q3 2021. 1-bed apartments in Al Raha Beach were available for an average yearly rent of AED 77k with no visible change in cost compared to Q2 2021. On the other hand, 2 and 3-bed flats have recorded increases between 4.5% and 8.1% in asking rents, averaging at AED 114k and AED 163k per annum.
Other than these top areas with luxury apartments in Abu Dhabi, tenants have been inclined towards upscale waterfront communities like Corniche Area, Corniche Road and Saadiyat Island in the capital city.
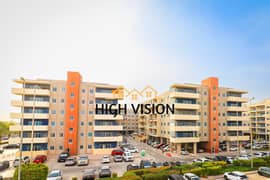
- 3 BEDS
- |
- 4 BATHS
- |
- 1420 SQFT
- 1 BED
- |
- 2 BATHS
- |
- 903 SQFT
MOHAMMED BIN ZAYED CITY IS THE MOST POPULAR FOR AFFORDABLE VILLA RENTALS IN ABU DHABI
TOP AREAS TO RENT AFFORDABLE VILLAS IN ABU DHABI – BAYUT & DUBIZZLE Q3 2021 ABU DHABI MARKET REPORT
POPULAR AREAS | 3-BED Avg. Yearly RentChange from Q2 2021 | 4-BED Avg. Yearly RentChange from Q2 2021 | 5-BED Avg. Yearly RentChange from Q2 2021 |
|---|---|---|---|
| Mohammed Bin Zayed City | 3-BED Avg. Yearly RentChange from Q2 2021
| 4-BED Avg. Yearly RentChange from Q2 2021
| 5-BED Avg. Yearly RentChange from Q2 2021
|
| Khalifa City A | 3-BED Avg. Yearly RentChange from Q2 2021
| 4-BED Avg. Yearly RentChange from Q2 2021
| 5-BED Avg. Yearly RentChange from Q2 2021
|
| Al Reef | 3-BED Avg. Yearly RentChange from Q2 2021
| 4-BED Avg. Yearly RentChange from Q2 2021
| 5-BED Avg. Yearly RentChange from Q2 2021
|
| Shakhbout City (Khalifa City B) | 3-BED Avg. Yearly RentChange from Q2 2021
| 4-BED Avg. Yearly RentChange from Q2 2021
| 5-BED Avg. Yearly RentChange from Q2 2021
|
| Al Muroor | 3-BED Avg. Yearly RentChange from Q2 2021
| 4-BED Avg. Yearly RentChange from Q2 2021
| 5-BED Avg. Yearly RentChange from Q2 2021
|
According to the combined Bayut & dubizzle data collected in Q3 2021, Mohammed Bin Zayed City has continued to appeal to those looking for affordable rental villas in Abu Dhabi. Convenient access to lifestyle amenities and proximity to Dubai have contributed to the district’s growing popularity.
The asking rents for 3-bed villas in Mohammed Bin Zayed City averaged at AED 98k, showing an uptick of 13.61%. 4 and 5-bed villas in Mohammed Bin Zayed City have averaged at AED 125k and AED 145k, exhibiting decreases of 1.3% to 2.9% in Q3 2021.
Khalifa City A has emerged as the second most sought-after area to rent cheap villas in Abu Dhabi. Given that the community offers excellent connectivity and family-friendly amenities, continued interest in Khalifa City A is not surprising.
As evident in Bayut & dubizzle’s combined market report, the asking rents of villas in Khalifa City A have seen minor declines across the board. 3-bed villas in Khalifa City A have averaged at AED 131k, reducing by 7.2% compared to the second quarter of 2021.
The rent of 4-bedroom villas in Khalifa City A has averaged at 145k, plummeting by 3.6%, in comparison to Q2 2021. Tenants looking for larger, affordable houses have also turned towards Khalifa City A’s 5-bedroom houses for rent available at an average yearly price of AED 164k.
In addition to these areas, Al Reef, Shakhbout City (Khalifa City B) and Al Muroor have been prominent among prospective tenants in Q3 2021.
AL BATEEN IS THE MOST POPULAR AREA FOR RENTING LUXURY VILLAS IN ABU DHABI
MOST POPULAR AREAS TO RENT LUXURY VILLAS IN ABU DHABI – BAYUT & DUBIZZLE Q3 2021 ABU DHABI MARKET REPORT
POPULAR AREAS | 4-BED Avg. Yearly RentChange from Q2 2021 | 5-BED Avg. Yearly RentChange from Q2 2021 | 6-BED Avg. Yearly RentChange from Q2 2021 |
|---|---|---|---|
| Al Bateen | 4-BED Avg. Yearly RentChange from Q2 2021
| 5-BED Avg. Yearly RentChange from Q2 2021
| 6-BED Avg. Yearly RentChange from Q2 2021
|
| Al Raha Gardens | 4-BED Avg. Yearly RentChange from Q2 2021
| 5-BED Avg. Yearly RentChange from Q2 2021
| 6-BED Avg. Yearly RentChange from Q2 2021
|
| Yas Island | 4-BED Avg. Yearly RentChange from Q2 2021
| 5-BED Avg. Yearly RentChange from Q2 2021
| 6-BED Avg. Yearly RentChange from Q2 2021
|
| Saadiyat Island | 4-BED Avg. Yearly RentChange from Q2 2021
| 5-BED Avg. Yearly RentChange from Q2 2021
| 6-BED Avg. Yearly RentChange from Q2 2021
|
| Not available due to low/no historical inventory or influx of off-plan properties | |||
As per the data released by Bayut & dubizzle for luxury villa rentals in Abu Dhabi, Al Bateen has continued to be the top choice among tenants. The asking rents of Al Bateen have surged by 12.9%. The rent for 4-bed villas in Al Bateen has averaged at AED 210k whereas 5-bed villas in Al Bateen have been priced at AED 230k. The price for 6-bed villa rentals in Al Bateen has averaged at AED 234k per annum in Q3 2021.
Al Raha Gardens has secured the second spot among the most desirable neighbourhoods to rent luxury villas in Abu Dhabi. The average rent of 4-bed houses in Al Raha Gardens has stood at AED 172k, rising by 11.4% compared to Q2 2021. Prospective tenants have also shown interest in 5-bed villas for rent in Al Raha Gardens. In the third quarter of 2021, the rents for 5-bed villas have averaged at AED 229k, witnessing a moderate surge of 7.2%.
In addition to Al Bateen and Al Raha Gardens, tenants have preferred to rent high-end villas in the popular island communities of Yas Island and Saadiyat Island in the third quarter of 2021.
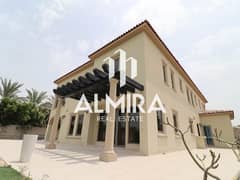
- 5 BEDS
- |
- 6 BATHS
- |
- 6097 SQFT
Commenting on the trends in the capital city’s real estate market, Haider Ali Khan, the CEO of Bayut & dubizzle and Head of EMPG MENA, said:
“Over the last few years, and especially during the pandemic Abu Dhabi has really established itself as one of the most family friendly, safe and stable cities to live in the world. Now that the city is once again open to people from within the country and abroad, it’s not surprising to see prices appreciating in both the rental and sales markets in the capital.
Besides the restriction-free mobility within and outside the borders of Abu Dhabi, there have been many reasons contributing to the upward price movements in the capital’s real estate market. The boom in the luxury segment in particular has remained consistent with consumers’ growing preference for larger, more private homes.
Additionally, Abu Dhabi’s recent announcement to grant UAE golden visas to real estate investors has also added to the growing appeal of the capital’s real estate sector for both global and expat investors. We have noticed a steady interest in the Abu Dhabi property market from buyers and tenants with close to 3.5 Million sessions in the last quarter alone.”
That brings an end to Abu Dhabi Q3 rental property market report 2021. As evident from the trends, the Abu Dhabi property market has maintained an equilibrium for demand and supply in the last quarter. A similar balance of price trends can also be seen in the Abu Dhabi Q3 2021 sales market report.
If you are curious about the rental trends of other real estate markets, you can refer to the Dubai 2021 quarterly market report for rent. You can also learn how the city’s investment sector has performed during the last three months via our Q3 2021 report for sales in Dubai.
Disclaimer: The above report is based on prices advertised on Bayut.com and dubizzle.com by real estate agencies on behalf of their clients. These prices are not representative of actual real estate transactions conducted in Abu Dhabi.


