Bayut’s Q1 2023 Abu Dhabi Rental Market Report
With the first quarter of 2023 wrapped up, it’s time to gain insights into key trends and patterns observed in the real estate sector of Abu Dhabi during the last three months. We’ve compiled the Abu Dhabi Q1 2023 rental property market report to provide you with a complete overview of tenants’ search preferences observed on Bayut.
A quick look at our Abu Dhabi Q1 rental real estate market report 2023 shows a higher demand for budget-friendly houses, which pushed the cost of villa rentals upwards in the affordable segment. However, the rents of luxury properties in Abu Dhabi remained tenant-friendly:
- In the affordable segment, prices declined by up to 8% for apartments, whereas villa rentals recorded increases of up to 13%.
- Rental costs for luxury properties recorded decreases of up to 15% in most cases, although prices for certain villa bed-types did increase.
To give you a detailed view of the Abu Dhabi rental market, we have compared average rents for villas and apartments from Q1 2023 to those observed in Q4 2022 (excluding room share).
RENTAL TRENDS IN ABU DHABI: TOP NEIGHBOURHOODS FOR RENTING VILLAS AND APARTMENTS IN Q1 2023
As per the data collected by Bayut, Q1 2023 witnessed an increased demand for villas in the affordable segment across Abu Dhabi’s well-established communities. This pushed landlords to advertise their rental properties at higher prices to capitalise on the growing demand for houses. When it comes to the luxury segment, the rental costs of properties became slightly more affordable to attract potential tenants.
Based on the data collected for Bayut’s Abu Dhabi Q1 real estate rental market report, budget-conscious tenants showed maximum interest in suburban areas such as:
- Khalifa City A
- Al Khalidiyah
- Mohammed Bin Zayed City
- Shakhbout City (Khalifa City B)
Those looking for luxury properties preferred the following integrated communities in Abu Dhabi:
- Al Reem Island
- Al Raha Beach
- Al Raha Gardens
- Yas Island
In the following sections we’ll dig a little deeper into the rental trends observed in the Bayut Abu Dhabi Q1 2023 property market report.
KHALIFA CITY A IS THE MOST SEARCHED-FOR AREA TO RENT AFFORDABLE FLATS IN ABU DHABI
RENTAL PRICES IN ABU DHABI FOR AFFORDABLE APARTMENTS IN POPULAR AREAS – BAYUT’S Q1 2023 MARKET REPORT
POPULAR AREAS | STUDIO Avg. Yearly RentChange from Q4 2022 | 1-BED Avg. Yearly RentChange from Q4 2022 | 2-BED Avg. Yearly RentChange from Q4 2022 |
|---|---|---|---|
| Khalifa City A | STUDIO Avg. Yearly RentChange from Q4 2022
| 1-BED Avg. Yearly RentChange from Q4 2022
| 2-BED Avg. Yearly RentChange from Q4 2022
|
| Al Khalidiyah | STUDIO Avg. Yearly RentChange from Q4 2022
| 1-BED Avg. Yearly RentChange from Q4 2022
| 2-BED Avg. Yearly RentChange from Q4 2022
|
| Hamdan Street | STUDIO Avg. Yearly RentChange from Q4 2022
| 1-BED Avg. Yearly RentChange from Q4 2022
| 2-BED Avg. Yearly RentChange from Q4 2022
|
| Al Muroor | STUDIO Avg. Yearly RentChange from Q4 2022
| 1-BED Avg. Yearly RentChange from Q4 2022
| 2-BED Avg. Yearly RentChange from Q4 2022
|
| Tourist Club Area (TCA) | STUDIO Avg. Yearly RentChange from Q4 2022
| 1-BED Avg. Yearly RentChange from Q4 2022
| 2-BED Avg. Yearly RentChange from Q4 2022
|
Based on the search trends recorded on Bayut, Khalifa City A emerged as the most popular choice to rent affordable apartments in Abu Dhabi:
- The average cost of studios and 1-bedroom rental apartments in Khalifa City A showed no change. However, the asking rents of 2-bedroom flats decreased by 3.14% from Q4 2022.
- On average, tenants paid AED 28k for studios, AED 42k for 1-bed and AED 61k for 2-bedroom flats for rent in Khalifa City A.
Al Khalidiyah also retained its popularity for reasonably-priced flats in Abu Dhabi:
- The rent for apartments in Al Khalidiyah reported modest fluctuations from those recorded in Q4 2022. The average rental cost of studios in Al Khalidiyah declined by 5.95%, whereas the asking prices for 1-bedroom rental apartments in Al Khalidiyah increased by 0.76%. The average prices for 2-bedroom rental flats in Al Khalidiyah remained unchanged in Q1 2023.
- The asking rent for studios in Al Khalidiyah averaged at AED 29k, whereas 1 and 2-bedroom apartments for rent in Al Khalidiyah were available for respective averages of AED 52k and AED 67k in Q1 2023.
Budget-conscious tenants looking for apartments, also showed interest in Hamdan Street during the first quarter of 2023:
- The average costs of studios and 1-bedroom rental apartments in Hamdan Street decreased by 1.31% and 2.55%, respectively. However, the rent for 2-bedroom flats in Hamdan Street surged by 0.77% in Q1 2023.
- On average, to rent apartments in Hamdan Street, tenants paid AED 33k for studios, AED 43k for 1-bed apartments and AED 59k for 2-bedroom units during Q1 2023.
In addition, renters interested in affordable accommodation also searched for properties in the following areas in Abu Dhabi:
- Al Muroor
- Tourist Club Area (TCA)
Average rents in Al Muroor generally decreased by between 2% and 8%. The asking rents for studios in TCA declined by 5%, whereas the rental prices for other property types remained unchanged in Q1 2023.
AL REEM ISLAND IS THE TOP CHOICE FOR LUXURY APARTMENT RENTALS IN ABU DHABI
POPULAR AREAS TO RENT HIGH-END APARTMENTS IN ABU DHABI – BAYUT’S Q1 2023 ABU DHABI MARKET REPORT
POPULAR AREAS | 1-BED Avg. Yearly RentChange from Q4 2022 | 2-BED Avg. Yearly RentChange from Q4 2022 | 3-BED Avg. Yearly RentChange from Q4 2022 |
|---|---|---|---|
| Al Reem Island | 1-BED Avg. Yearly RentChange from Q4 2022
| 2-BED Avg. Yearly RentChange from Q4 2022
| 3-BED Avg. Yearly RentChange from Q4 2022
|
| Al Raha Beach | 1-BED Avg. Yearly RentChange from Q4 2022
| 2-BED Avg. Yearly RentChange from Q4 2022
| 3-BED Avg. Yearly RentChange from Q4 2022
|
| Corniche Area | 1-BED Avg. Yearly RentChange from Q4 2022
| 2-BED Avg. Yearly RentChange from Q4 2022
| 3-BED Avg. Yearly RentChange from Q4 2022
|
| Yas Island | 1-BED Avg. Yearly RentChange from Q4 2022
| 2-BED Avg. Yearly RentChange from Q4 2022
| 3-BED Avg. Yearly RentChange from Q4 2022
|
| Corniche Road | 1-BED Avg. Yearly RentChange from Q4 2022
| 2-BED Avg. Yearly RentChange from Q4 2022
| 3-BED Avg. Yearly RentChange from Q4 2022
|
On the luxury front, Al Reem Island emerged as the top choice among those searching for upscale apartments in Abu Dhabi:
- The average rents for apartments in Al Reem Island reported modest increments, with the asking prices increasing by 1.66% to 2.13%.
- Interested tenants acquired 1-bedroom rental apartments in Al Reem Island for an average of AED 59k, 2-bedroom flats for AED 87k and 3-bedroom units for AED 128k in Q1 2023.
The seafront community of Al Raha Beach also gained traction for high-end apartments in Abu Dhabi:
- The asking rent for 1-bedroom apartments in Al Raha Beach showed a significant decline of 14.5%, with landlords pricing their properties competitively to attract tenants. Similarly, the average rent for 2-bedroom flats declined by 9.22%. However, the rent for 3-bedroom apartments in Al Raha Beach surged by 6.49% in Q1 2023.
- The asking rents for 1-bed flats in Al Raha Beach averaged at AED 66k, whereas 2 and 3-bed rental flats in Al Raha Beach were priced at AED 102k and AED 166k, respectively.
Tenants also searched for apartments in Corniche Area to rent luxury apartments in Abu Dhabi:
- The average rent for 1-bedroom apartments in the Corniche Area remained unchanged. However, the rents for 2 and 3-bedroom flats in the Corniche Area decreased by 2.16% and 6.72%, respectively.
- On average, 1-bedroom apartments in Corniche Area were priced at AED 75k, whereas 2 and 3-bedroom flats were rented out for AED 100k and AED 119k.
Apart from the aforementioned areas, tenants showed an inclination towards the following communities in Abu Dhabi:
The average rents for apartments in Yas Island recorded a significant decrease of up to 13%, consequent to a decline in the inventory of advertised properties. However, the costs of rental flats in Corniche Road climbed up by up to 4% in the first quarter of 2023.

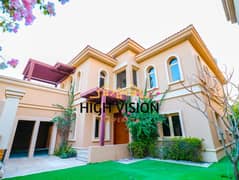
- 1 BED
- |
- 2 BATHS
- |
- 801 SQFT
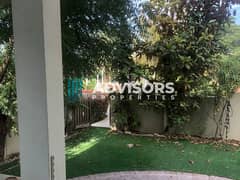
- 3 BEDS
- |
- 4 BATHS
- |
- 2169 SQFT
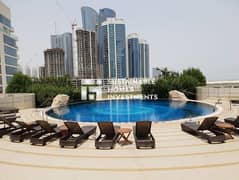
- 4 BEDS
- |
- 5 BATHS
- |
- 5314 SQFT
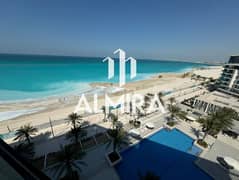
- 4 BEDS
- |
- 4 BATHS
- |
- 2444 SQFT
MOHAMMED BIN ZAYED CITY IS THE MOST POPULAR AREA FOR RENTING AFFORDABLE VILLAS IN ABU DHABI
MOST POPULAR AREAS TO RENT REASONABLY-PRICED VILLAS IN ABU DHABI – BAYUT Q1 2023 ABU DHABI MARKET REPORT
POPULAR AREAS | 3-BED Avg. Yearly RentChange from Q4 2022 | 4-BED Avg. Yearly RentChange from Q4 2022 | 5-BED Avg. Yearly RentChange from Q4 2022 |
|---|---|---|---|
| Mohammed Bin Zayed City | 3-BED Avg. Yearly RentChange from Q4 2022
| 4-BED Avg. Yearly RentChange from Q4 2022
| 5-BED Avg. Yearly RentChange from Q4 2022
|
| Khalifa City A | 3-BED Avg. Yearly RentChange from Q4 2022
| 4-BED Avg. Yearly RentChange from Q4 2022
| 5-BED Avg. Yearly RentChange from Q4 2022
|
| Shakhbout City (Khalifa City B) | 3-BED Avg. Yearly RentChange from Q4 2022
| 4-BED Avg. Yearly RentChange from Q4 2022
| 5-BED Avg. Yearly RentChange from Q4 2022
|
| Madinat Al Riyadh | 3-BED Avg. Yearly RentChange from Q4 2022
| 4-BED Avg. Yearly RentChange from Q4 2022
| 5-BED Avg. Yearly RentChange from Q4 2022
|
| Al Reef | 3-BED Avg. Yearly RentChange from Q4 2022
| 4-BED Avg. Yearly RentChange from Q4 2022
| 5-BED Avg. Yearly RentChange from Q4 2022
|
For those looking to rent affordable houses in Abu Dhabi, Mohammed Bin Zayed City remained the top choice in the first quarter of 2023:
- Rents of villas in Mohammed Bin Zayed City reported moderate fluctuations across the board. The average rent for 3-bed houses in Mohammed Bin Zayed City decreased by 7.41%, whereas the asking rent for 4-bedroom villas recorded no change. The average rent for 5-bedroom houses in Mohammed Bin Zayed City rose by 0.62%.
- On average, tenants spent AED 93k for 3-bed villas, AED 128k for 4-bed houses and AED 147k for 5-bed units in Mohammed Bin Zayed City.
The family-friendly suburb of Khalifa City A remained a firm favourite among budget-conscious renters in Q1 2023:
- Average prices for 3-bed and 5-bed rental houses in Khalifa City A increased by 1.18% and 3.80%, whereas 4-bed villas in Khalifa City A recorded a decline of 2% in average prices.
- The asking rents for houses in Khalifa City A averaged at AED 134k for 3-bed villas, AED 148k for 4-bed units and AED 169k for 5-bed houses.
Shakhbout City (Khalifa City B) also attracted tenants searching for affordable villas in Abu Dhabi:
- The average rents for houses in Shakhbout City (Khalifa City B) increased across the board, recording changes of 0.54% to 4.55% in Q1 2023.
- The rental cost of 3-bed houses in Shakhbout City (Khalifa City B) averaged at AED 115k, whereas 4 and 5-bed rental villas were rented out for AED 133k and AED 150k respectively.
Other areas that caught the interest of villa renters in Q1 2023 include:
- Madinat Al Riyadh
- Al Reef
The rental prices for villas in Al Reef remained unchanged. However, the average rents of 3 and 5-bed houses in Madinat Al Riyadh increased by up to 13%, which could be due to landlords pricing their properties higher to capitalise on the growing demand for affordable villas. On the contrary, the cost of 4-bedroom rental villas in Madinat Al Riyadh declined by 6.21% in Q1 2023.
AL RAHA GARDENS IS THE MOST POPULAR AREA FOR RENTING LUXURY VILLAS IN ABU DHABI
MOST POPULAR AREAS TO RENT LUXURY VILLAS IN ABU DHABI – BAYUT Q1 2023 ABU DHABI MARKET REPORT
POPULAR AREAS | 4-BED Avg. Yearly RentChange from Q4 2022 | 5-BED Avg. Yearly RentChange from Q4 2022 | 6-BED Avg. Yearly RentChange from Q4 2022 |
|---|---|---|---|
| Al Raha Gardens | 4-BED Avg. Yearly RentChange from Q4 2022
| 5-BED Avg. Yearly RentChange from Q4 2022
| 6-BED Avg. Yearly RentChange from Q4 2022
|
| Yas Island | 4-BED Avg. Yearly RentChange from Q4 2022
| 5-BED Avg. Yearly RentChange from Q4 2022
| 6-BED Avg. Yearly RentChange from Q4 2022
|
| Al Bateen | 4-BED Avg. Yearly RentChange from Q4 2022
| 5-BED Avg. Yearly RentChange from Q4 2022
| 6-BED Avg. Yearly RentChange from Q4 2022
|
| Saadiyat Island | 4-BED Avg. Yearly RentChange from Q4 2022
| 5-BED Avg. Yearly RentChange from Q4 2022
| 6-BED Avg. Yearly RentChange from Q4 2022
|
| Al Karamah | 4-BED Avg. Yearly RentChange from Q4 2022
| 5-BED Avg. Yearly RentChange from Q4 2022
| 6-BED Avg. Yearly RentChange from Q4 2022
|
| Not available due to low/no historical inventory or influx of off-plan properties | |||
When it comes to luxury villas, Al Raha Gardens captured the most interest from tenants in Q1 2023:
- The average rent for 4-bed villas in Al Raha Gardens dropped by 9.67%, which could be due to landlords pricing their properties competitively to drive demand for them. On the contrary, the asking rent for 5-bed houses in Al Raha Gardens recorded an increase of 7.19% from Q4 2022.
- On average, tenants spent AED 167k for 4-bed houses and AED 228k for 5-bed villas in Al Raha Gardens during Q1 2023.
Tenants looking for high-end villas also, unsurprisingly, gravitated towards Yas Island in Q1 2023:
- The asking rents for 4-bed villas in Yas Island recorded a decrease of 11.6%, which could be attributed to a decline in inventory. In contrast, 5-bed houses in Yas Island observed increases of 1.24% in their average rental costs.
- 4-bed houses in Yas Island were priced at AED 309k, where the majority of the limited inventory consists of uber luxury units in Yas Acres, resulted in price points higher than 5-bed units. The rent for 5-bed villas in Yas Island averaged at AED 300k.
Al Bateen was another area that garnered the attention of tenants looking for luxury houses in Abu Dhabi:
- The average cost of 4-bed and 6-bed rental houses in Al Bateen experienced declines of 2.57% and 5.27% respectively. However, the asking rents for 5-bed villas in Al Bateen became more expensive by 5.30% in Q1 2023.
- The asking rents of 4 and 5-bedroom houses in Al Bateen averaged at AED 185k and AED 237k respectively. The 6-bedroom villas in Al Bateen were rented for an average of AED 243k in Q1 2023.
Besides these areas, tenants also focused their interest on:
- Saadiyat Island
- Al Karamah
The asking rent for 5-bed villas in Saadiyat Island surged by 2.53%, following an increase in property listings from Saadiyat Lagoons, Abu Dhabi.
- 5 BEDS
- |
- 6 BATHS
- |
- 6097 SQFT
- 5 BEDS
- |
- 5 BATHS
- |
- 2941 SQFT
Commenting on the trends in Abu Dhabi, Haider Ali Khan, the CEO of Bayut & dubizzle and the Head of EMPG MENA said:
“As one of the most stable real estate markets, not just in the UAE, but also in the wider GCC region, Abu Dhabi continues to attract potential buyers and investors looking for long term gains. Interest remains high in upscale, integrated communities which are also being well placed from a tourism perspective. Footfall in communities like Yas Island and Saadiyat Island keeps growing, and properties in these areas are still far more competitive with the average price per square foot not exceeding $500- $600, compared to global waterfront communities where price per sq.ft tends to be well over the $5000 mark.
Traffic on Bayut for listings in Abu Dhabi have exceeded 4.5 Million sessions in the first quarter alone, and transactions have also increased with DARI reporting over 60% increase in off-plan transactions compared to the same period in 2022. All these trends indicate a promising start for the capital this year.”
That brings an end to our analysis of the Abu Dhabi rental market report for Q1 2023. If you’re looking for similar insight into the sales side of the capital’s real estate market, it’s very much worth checking out our Q1 2023 Abu Dhabi Sales Market Report.
Are you considering investing in Dubai real estate? You can gain valuable insight into Dubai’s property sector with our Bayut’s Dubai sales market report Q1 2023.
For more information and updates about the UAE real estate sector, stay tuned to MyBayut.
Disclaimer: The above report (MKKT RPT Q1 2023) is based on prices for ready properties advertised on Bayut.com by real estate agencies on behalf of their clients. These prices are not representative of actual real estate transactions conducted in Abu Dhabi.


