Bayut & dubizzle’s Abu Dhabi Q1 2022 rental market report
As we move into the second quarter of 2022, it’s time to look at the rent trends in Abu Dhabi as observed during the last three months. Our analysis shows that Abu Dhabi’s rental market has been largely tenant friendly in Q1 2022, with rental prices for apartments remaining mostly unchanged and those for villas experiencing moderate increases.
The property price trends in Abu Dhabi observed in the first quarter of 2022 indicate that there is still a steady demand for larger homes from prospective tenants, particularly stand-alone units. In addition, the fact that more people are looking for greater value for money in rental homes may have led landlords to keep apartment rental charges competitive in order to drive demand for their properties.
According to Bayut & dubizzle’s Abu Dhabi Q1 rental property market report 2022, the market has recorded decreases of up to 13% for apartments and villas in the affordable segment, whereas the luxury segment has exhibited an uptrend of up to 26% in Q1 2022.
If we look at the Abu Dhabi property market statistics presented in this Q1 2022 report, we can see that family-friendly areas like Khalifa City A and Mohammed Bin Zayed City have continued to garner tenants’ attention to rent affordable apartments and houses. Alternatively, high-income tenants have preferred waterfront communities such as Al Reem Island and Al Mushrif for apartment and villa rentals in the capital.
To give you an in-depth insight into Abu Dhabi’s property prices for rental properties, Bayut & dubizzle’s combined Abu Dhabi rental property market report compares average rental prices for villas and apartments from Q1 2022 to Q4 2021 (excluding room share). We have further segmented popular areas into ‘Affordable’ and ‘Luxury’ sections for a better analysis of consumer behaviour.
KHALIFA CITY A GARNERS MAXIMUM CONSUMER INTEREST FOR RENTING AFFORDABLE APARTMENTS
RENTAL PROPERTY PRICES IN ABU DHABI FOR AFFORDABLE APARTMENTS IN POPULAR AREAS – BAYUT & DUBIZZLE’S ABU DHABI Q1 RENTAL REAL ESTATE MARKET REPORT 2022
POPULAR AREAS | STUDIO Avg. Yearly RentChange from Q4 2021 | 1-BED Avg. Yearly RentChange from Q4 2021 | 2-BED Avg. Yearly RentChange from Q4 2021 |
|---|---|---|---|
| Khalifa City A | STUDIO Avg. Yearly RentChange from Q4 2021
| 1-BED Avg. Yearly RentChange from Q4 2021
| 2-BED Avg. Yearly RentChange from Q4 2021
|
| Al Khalidiyah | STUDIO Avg. Yearly RentChange from Q4 2021
| 1-BED Avg. Yearly RentChange from Q4 2021
| 2-BED Avg. Yearly RentChange from Q4 2021
|
| Al Muroor | STUDIO Avg. Yearly RentChange from Q4 2021
| 1-BED Avg. Yearly RentChange from Q4 2021
| 2-BED Avg. Yearly RentChange from Q4 2021
|
| Hamdan Street | STUDIO Avg. Yearly RentChange from Q4 2021
| 1-BED Avg. Yearly RentChange from Q4 2021
| 2-BED Avg. Yearly RentChange from Q4 2021
|
| Tourist Club Area (TCA) | STUDIO Avg. Yearly RentChange from Q4 2021
| 1-BED Avg. Yearly RentChange from Q4 2021
| 2-BED Avg. Yearly RentChange from Q4 2021
|
As per the trends observed for Q1 2022, Khalifa City A has emerged as the most popular area for renting affordable apartments in Abu Dhabi. The area’s sustained popularity could be attributed to its suburban setting, convenient lifestyle amenities and easy access to Dubai.
The average yearly rents for studios and 1-bed apartments in Khalifa City A have averaged at AED 28k and AED 41k, exhibiting no change from Q4 2021. Contrary to this, 2-bed apartments in Khalifa City A have averaged at AED 59k, recording a moderate decline of 4.12%, compared to the last quarter of 2021.
The second area that has continued to be a tenant favourite in Q1 2022 is Al Khalidiyah. The area is known for its central location, proximity to Abu Dhabi Corniche Beach and has a host of retail, cultural and recreational offerings.
Al Khalidiyah has experienced minor fluctuations in average rents in Q1 2022. The asking rents of studios in Al Khalidiyah have averaged at AED 29k, increasing slightly by 2.82%, whereas 1-bedroom apartments in Al Khalidiyah have declined by 2.65% to stand at AED 51k in Q1 2022. No change, however, has been observed in the yearly rents of 2-bedroom apartments in Al Khalidiyah, which were rented out for AED 67k on average in Q1 2022.
Aside from these areas, centrally-located family-friendly communities such as Al Muroor, Hamdan Street and Tourist Club Area (TCA) have gained traction among those keen on renting reasonably-priced flats in Abu Dhabi. As per the real estate trends observed in Q1 2022, the average rents in these family-friendly areas have declined from 2% to 10%, dependent on area and unit type.
AL REEM ISLAND IS THE TOP CHOICE FOR LUXURY APARTMENT RENTALS IN ABU DHABI
POPULAR AREAS TO RENT HIGH-END APARTMENTS IN ABU DHABI – BAYUT & DUBIZZLE Q1 2022 ABU DHABI MARKET REPORT
POPULAR AREAS | 1-BED Avg. Yearly RentChange from Q4 2021 | 2-BED Avg. Yearly RentChange from Q4 2021 | 3-BED Avg. Yearly RentChange from Q4 2021 |
|---|---|---|---|
| Al Reem Island | 1-BED Avg. Yearly RentChange from Q4 2021
| 2-BED Avg. Yearly RentChange from Q4 2021
| 3-BED Avg. Yearly RentChange from Q4 2021
|
| Al Raha Beach | 1-BED Avg. Yearly RentChange from Q4 2021
| 2-BED Avg. Yearly RentChange from Q4 2021
| 3-BED Avg. Yearly RentChange from Q4 2021
|
| Corniche Area | 1-BED Avg. Yearly RentChange from Q4 2021
| 2-BED Avg. Yearly RentChange from Q4 2021
| 3-BED Avg. Yearly RentChange from Q4 2021
|
| Yas Island | 1-BED Avg. Yearly RentChange from Q4 2021
| 2-BED Avg. Yearly RentChange from Q4 2021
| 3-BED Avg. Yearly RentChange from Q4 2021
|
| Corniche Road | 1-BED Avg. Yearly RentChange from Q4 2021
| 2-BED Avg. Yearly RentChange from Q4 2021
| 3-BED Avg. Yearly RentChange from Q4 2021
|
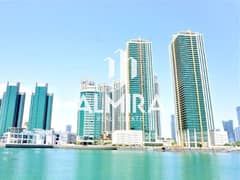
On the luxury front, Al Reem Island has unsurprisingly emerged as the most popular area to rent upscale apartments in Abu Dhabi. Situated on the eastern side of central Abu Dhabi, the area offers luxury, waterfront living in the city.
The asking rents of 1-bed apartments in Al Reem Island have averaged at AED 59k, rising marginally by 2.95%, whereas 2-bed apartments have averaged at AED 85k, reporting no change from Q4 2021. However, there has been a slight increase of 0.72% in the rental costs of 3-bed apartments in Al Reem Island, to now stand at AED 131k per annum.
Another waterfront area that has appealed to tenants in Q1 2022 is Al Raha Beach. The area has an impressive portfolio of luxury seafront properties, which contributes to its growing popularity.
The asking rents of 1 and 2-bed apartments in Al Raha Beach have averaged at AED 72k and AED 106k, recording respective declines of 6.94% and 6.28% from Q4 2021. For the 3-bed flats in Al Raha Beach, the rents have nominally increased by 0.46% to average at AED 166k per annum.
Apart from these areas, Corniche Area, Yas Island and Corniche Road have garnered attention when it comes to upscale apartment rentals in Abu Dhabi.
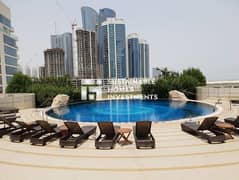
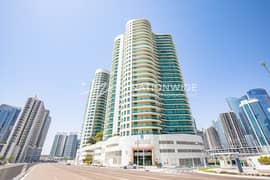
Amidst all these areas, the rental prices in Corniche Area have recorded decreases across the board, with some units noting a decrease of up to 14%. This could be attributed to landlords listing properties at lower price ends, particularly in Nation Towers, Al Jowhara Tower, Saraya and Meera Time Towers.
- 3 BEDS
- |
- 4 BATHS
- |
- 2169 SQFT
- 3 BEDS
- |
- 4 BATHS
- |
- 2090 SQFT
- 2 BEDS
- |
- 3 BATHS
- |
- 1614 SQFT
- 3 BEDS
- |
- 4 BATHS
- |
- 1775 SQFT
MOHAMMED BIN ZAYED CITY IS THE MOST POPULAR FOR AFFORDABLE VILLA RENTALS IN ABU DHABI
MOST SOUGHT-AFTER AREAS TO RENT AFFORDABLE VILLAS IN ABU DHABI – BAYUT & DUBIZZLE Q1 2022 ABU DHABI MARKET REPORT ANALYSIS
POPULAR AREAS | 3-BED Avg. Yearly RentChange from Q4 2021 | 4-BED Avg. Yearly RentChange from Q4 2021 | 5-BED Avg. Yearly RentChange from Q4 2021 |
|---|---|---|---|
| Mohammed Bin Zayed City | 3-BED Avg. Yearly RentChange from Q4 2021
| 4-BED Avg. Yearly RentChange from Q4 2021
| 5-BED Avg. Yearly RentChange from Q4 2021
|
| Khalifa City A | 3-BED Avg. Yearly RentChange from Q4 2021
| 4-BED Avg. Yearly RentChange from Q4 2021
| 5-BED Avg. Yearly RentChange from Q4 2021
|
| Shakhbout City (Khalifa City B) | 3-BED Avg. Yearly RentChange from Q4 2021
| 4-BED Avg. Yearly RentChange from Q4 2021
| 5-BED Avg. Yearly RentChange from Q4 2021
|
| Al Shamkha South | 3-BED Avg. Yearly RentChange from Q4 2021
| 4-BED Avg. Yearly RentChange from Q4 2021
| 5-BED Avg. Yearly RentChange from Q4 2021
|
| Al Reef | 3-BED Avg. Yearly RentChange from Q4 2021
| 4-BED Avg. Yearly RentChange from Q4 2021
| 5-BED Avg. Yearly RentChange from Q4 2021
|
As per Bayut & dubizzle’s combined data for Q1 2022, Mohammed Bin Zayed City has been the most-searched-for area with regard to renting villas in Abu Dhabi. The area’s accessibility to Dubai and provision of lifestyle amenities have continued to make it a popular choice with tenants.
The average yearly rents of 3-bed villas in Mohammed Bin Zayed City have decreased by 6.76% to stand at AED 85k, whereas rental costs for 4-bed villas have recorded a minor appreciation of 0.16% to average at AED 129k in Q1 2022. A moderate decrease of 3.12% has been observed in 5-bed houses for rent in Mohammed Bin Zayed City, which were let out for AED 141k, on average.
Another area that has continuously drawn tenants towards its reasonably-priced properties is Khalifa City A. Ideal for those commuting from Abu Dhabi to Dubai, this has been the second most popular choice for renting villas in the capital city.
The asking rents of 3-bedroom villas in Khalifa City A have seen a minor appreciation of 2.31%, averaging at AED 140k. Rental costs for 4-bed villas in the community have averaged at AED 149k, recording a slight decline of 0.23% from Q4 2021. When it comes to the more spacious 5-bed houses in Khalifa City A, rental costs have appreciated by 2.28% to stand at AED 164k in Q1 2022.
In addition to these aforementioned areas, tenants have been largely inclined toward well-established suburban districts like Shakhbout City (Khalifa City B), Al Shamkha South and Al Reef. Rental costs in these areas have mostly declined, by up to 13%.
The largest decrease has been recorded in Al Shamkha South, particularly for stand-alone 3-bed villas, where prices went down by 12.67%. This price shift is subsequent to an increased number of lower-priced listings.
AL MUSHRIF IS THE MOST POPULAR AREA FOR RENTING LUXURY VILLAS IN ABU DHABI
MOST POPULAR AREAS TO RENT LUXURY VILLAS IN ABU DHABI – BAYUT & DUBIZZLE Q1 2022 ABU DHABI MARKET REPORT
POPULAR AREAS | 4-BED Avg. Yearly RentChange from Q4 2021 | 5-BED Avg. Yearly RentChange from Q4 2021 | 6-BED Avg. Yearly RentChange from Q4 2021 |
|---|---|---|---|
| Al Mushrif | 4-BED Avg. Yearly RentChange from Q4 2021
| 5-BED Avg. Yearly RentChange from Q4 2021
| 6-BED Avg. Yearly RentChange from Q4 2021
|
| Al Bateen | 4-BED Avg. Yearly RentChange from Q4 2021
| 5-BED Avg. Yearly RentChange from Q4 2021
| 6-BED Avg. Yearly RentChange from Q4 2021
|
| Yas Island | 4-BED Avg. Yearly RentChange from Q4 2021
| 5-BED Avg. Yearly RentChange from Q4 2021
| 6-BED Avg. Yearly RentChange from Q4 2021
|
| Al Raha Gardens | 4-BED Avg. Yearly RentChange from Q4 2021
| 5-BED Avg. Yearly RentChange from Q4 2021
| 6-BED Avg. Yearly RentChange from Q4 2021
|
| Saadiyat Island | 4-BED Avg. Yearly RentChange from Q4 2021
| 5-BED Avg. Yearly RentChange from Q4 2021
| 6-BED Avg. Yearly RentChange from Q4 2021
|
| Not available due to low/no historical inventory or influx of off-plan properties | |||
As per Bayut & dubizzle’s combined data for Q1 2022, Al Mushrif has emerged as the first choice for those seeking luxury villa rentals in Abu Dhabi. Al Mushrif is a family-oriented area located in the centre of the capital, with easy access to the notable landmarks around the city, contributing to its popularity among residents.
The rental costs of 4-bed villas in Al Mushrif have averaged at AED 172k, increasing by 1.18% in Q1 2022. The rental costs for 5-bed villas have decreased marginally by 0.53%, averaging at AED 191k. For the 6-bed rental houses in Al Mushrif, asking prices have experienced a moderate increase of 7.50% to stand at AED 223k in the first quarter of 2022.
The next area that has retained its popularity for upscale villas for rent in Abu Dhabi is Al Bateen. The asking rents of 4-bed villas in Al Bateen have increased significantly by 25.1% to average at AED 276k in Q1 2022. These units are relatively newer constructions available in a limited inventory, which pushes their rental prices up to cope with the steady demand for newer 4-bed homes in the area.
The asking rents for 5-bed houses in Al Bateen have decreased slightly by 1.8%, averaging at AED 221k per annum. A considerable increase of 7.94% has been recorded in the rents for 6-bedroom villas in Al Bateen, to stand at AED 241k in Q1 2022.
The waterfront community of Yas Island has secured the third spot in the list of most popular areas to rent villas in Abu Dhabi. The asking rents of 4-bedroom villas in Yas Island have recorded a negligible increase of 0.7%, averaging at AED 267k, per annum. On the contrary, the average yearly rents of 5-bedroom villas in Yas Island have dropped by 2.97% to stand at AED 289k in Q1 2022.
Apart from the areas mentioned above, tenants have favoured Abu Dhabi’s well-developed communities such as Al Raha Gardens and Saadiyat Island in Q1 2022. Prices for Saadiyat Island have experienced moderate declines of up to 5% for 4 and 5-bed units, averaging at AED 366k and AED 500k in Q1 2022.
- 5 BEDS
- |
- 5 BATHS
- |
- 2941 SQFT

- 4 BEDS
- |
- 5 BATHS
- |
- 6771 SQFT
- 2 BEDS
- |
- 3 BATHS
- |
- 1203 SQFT
Commenting on the trends in the capital, Haider Ali Khan, the CEO of Bayut & dubizzle and the Head of EMPG MENA said:
“Over the last two quarters, Abu Dhabi has scaled back on restrictions pertaining to COVID considerably, so there is a predictable surge in interest, particularly in the luxury areas. The major developer in the capital, Aldar Properties has also announced some new projects recently, fuelled by the increasing demand in the city. Within Bayut & dubizzle, traffic to the properties in the capital have also grown each quarter, with a total of over 3.5M sessions in the first three months alone.”
That concludes our Abu Dhabi Q1 rental property market report 2022. As is evident from the report, Abu Dhabi’s property market remained largely stable, with competitive prices maintaining an equilibrium of demand and supply in the capital.
If you want to learn about the sales trends of the market, check out our Abu Dhabi sales report for Q1 2022.
Similar to Abu Dhabi, Dubai’s property market has been on a sustained growth trajectory. To know how the market has performed during the last three months, check out Dubai’s sales market report for Q1 2022. Alternatively, you can read up on Dubai’s Q1 rental market report 2022 to gain in-depth insights into the emirate’s rental market.
Aside from these emirates, we will be rolling out market reports for Ajman and Sharjah within the next couple of days, so stay tuned to MyBayut.
Disclaimer: The above report is based on prices advertised on Bayut.com and dubizzle.com by real estate agencies on behalf of their clients. These prices are not representative of actual real estate transactions conducted in Abu Dhabi.


