Bayut & dubizzle’s Abu Dhabi H1 2022 rental market report
As we enter into the second half of 2022, it’s time to analyse the rental trends in Abu Dhabi observed during the first six months of the year. As per our Abu Dhabi H1 rental market report 2022, prices have remained largely favourable for tenants, with the rents for apartments and villas mostly decreasing in some of the emirate’s highly searched for residential districts.
The rental trends in Abu Dhabi real estate in H1 2022 have shown a steady demand for larger homes and established communities leading to more competitive pricing from landlords, especially in areas with a healthy inventory.
If we look at the real estate statistics presented in Bayut & dubizzle’s H1 Abu Dhabi rental market report 2022, prices for apartments and villas in the affordable segment have generally decreased across the board, by up to 13% in some cases. The luxury segment has also recorded price dips of up to 11% in the popular neighbourhoods of Abu Dhabi.
According to our Abu Dhabi real estate market overview in H1 2022, family-friendly communities like Khalifa City A and Mohammed Bin Zayed City have largely appealed to budget-conscious tenants interested in affordable apartments and houses. Alternatively, tenants interested in more luxurious units have searched for units in centrally located or waterfront communities like Al Mushrif and Al Reem Island for upscale apartments and houses in the capital.
To give you an in-depth insight into Abu Dhabi’s property prices for rental properties, Bayut & dubizzle’s Abu Dhabi rental property market report compares average rental prices for villas and apartments from H1 2022 to H2 2021 (excluding room share). We have further segmented popular areas into ‘Affordable’ and ‘Luxury’ sections for a more concise and detailed analysis of consumer behaviour.
KHALIFA CITY A IS THE MOST POPULAR AREA FOR RENTING AFFORDABLE APARTMENTS
RENTAL PROPERTY PRICES IN ABU DHABI FOR AFFORDABLE APARTMENTS IN POPULAR AREAS – BAYUT & DUBIZZLE’S ABU DHABI H1 RENTAL REAL ESTATE MARKET REPORT 2022
POPULAR AREAS | STUDIO Avg. Yearly RentChange from H2 2021 | 1-BED Avg. Yearly RentChange from H2 2021 | 2-BED Avg. Yearly RentChange from H2 2021 |
|---|---|---|---|
| Khalifa City A | STUDIO Avg. Yearly RentChange from H2 2021
| 1-BED Avg. Yearly RentChange from H2 2021
| 2-BED Avg. Yearly RentChange from H2 2021
|
| Al Khalidiyah | STUDIO Avg. Yearly RentChange from H2 2021
| 1-BED Avg. Yearly RentChange from H2 2021
| 2-BED Avg. Yearly RentChange from H2 2021
|
| Al Muroor | STUDIO Avg. Yearly RentChange from H2 2021
| 1-BED Avg. Yearly RentChange from H2 2021
| 2-BED Avg. Yearly RentChange from H2 2021
|
| Hamdan Street | STUDIO Avg. Yearly RentChange from H2 2021
| 1-BED Avg. Yearly RentChange from H2 2021
| 2-BED Avg. Yearly RentChange from H2 2021
|
| Tourist Club Area (TCA) | STUDIO Avg. Yearly RentChange from H2 2021
| 1-BED Avg. Yearly RentChange from H2 2021
| 2-BED Avg. Yearly RentChange from H2 2021
|
As per the trends observed by Bayut & dubizzle, Khalifa City A has emerged as the most searched-for area to rent affordable apartments in Abu Dhabi. The area’s sustained popularity can be attributed to its family-friendly amenities and close proximity to Dubai.
The average rent of studios in Khalifa City has been AED 28k, increasing by 3.28% compared to H2 2021. The cost of 1-bed rental apartments in Khalifa City A have averaged at AED 42k, after a minimal increase of 0.64%. However, the rent of 2-bed apartments in Khalifa City A has declined by 1.42% to average at AED 59k in H1 2022.
Al Khalidiyah has ranked second in popularity among areas to rent affordable apartments in Abu Dhabi. The average rents of Al Khalidiyah have seen moderate appreciations across the board. Studios for rent in Al Khalidiyah have averaged at AED 29k after a moderate uptick of 3.1% when compared to H2 2021. The rents of 1-bedroom apartments have surged nominally by 3.74% to stand at AED 52k. Prices for 2-bed rental apartments in Al Khalidiyah have increased by 2.57% to average at AED 67k in H1 2022.
Aside from these areas, Al Muroor, Hamdan Street and Tourist Club Area (TCA) have attracted tenants looking for cheap apartments in Abu Dhabi during H1 2022.
AL REEM ISLAND IS THE TOP CHOICE FOR LUXURY APARTMENT RENTALS IN ABU DHABI
POPULAR AREAS TO RENT HIGH-END APARTMENTS IN ABU DHABI – BAYUT & DUBIZZLE H1 2022 ABU DHABI MARKET REPORT
POPULAR AREAS | 1-BED Avg. Yearly RentChange from H2 2021 | 2-BED Avg. Yearly RentChange from H2 2021 | 3-BED Avg. Yearly RentChange from H2 2021 |
|---|---|---|---|
| Al Reem Island | 1-BED Avg. Yearly RentChange from H2 2021
| 2-BED Avg. Yearly RentChange from H2 2021
| 3-BED Avg. Yearly RentChange from H2 2021
|
| Al Raha Beach | 1-BED Avg. Yearly RentChange from H2 2021
| 2-BED Avg. Yearly RentChange from H2 2021
| 3-BED Avg. Yearly RentChange from H2 2021
|
| Corniche Area | 1-BED Avg. Yearly RentChange from H2 2021
| 2-BED Avg. Yearly RentChange from H2 2021
| 3-BED Avg. Yearly RentChange from H2 2021
|
| Yas Island | 1-BED Avg. Yearly RentChange from H2 2021
| 2-BED Avg. Yearly RentChange from H2 2021
| 3-BED Avg. Yearly RentChange from H2 2021
|
| Corniche Road | 1-BED Avg. Yearly RentChange from H2 2021
| 2-BED Avg. Yearly RentChange from H2 2021
| 3-BED Avg. Yearly RentChange from H2 2021
|
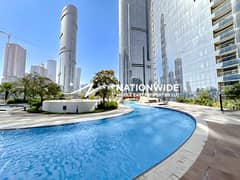
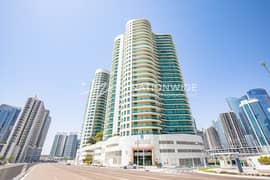
On the luxury front, the popular community of Al Reem Island has remained the most-searched-for area to rent luxury apartments in Abu Dhabi in H1 2022. The area’s rising popularity points towards tenants’ sustained interest in upscale, waterfront properties in the capital.
The asking rents of apartments in Al Reem Island have risen across the board. The average rent of 1-bed apartments in Al Reem Island has increased by 3.55% to stand at AED 59k. The rental costs of 2-bed flats in Al Reem Island have recorded an uptick of 1.95% to average at AED 87k. The average yearly rent of 3-bedroom apartments in Al Reem Island has been AED 128k, after an increase of 1.70% from H2 2021.
Al Raha Beach is another waterfront area that has attracted tenant interest for luxury apartments in Abu Dhabi. In H1 2022, the asking rents of flats in Al Raha Beach have declined across the board. The 1-bed apartments for rent in Al Raha Beach have averaged at AED 70k, following a dip of 9.39% from H2 2021, whereas 2-bed flats have recorded 6.82% decline in rental costs, to now average at AED 105k. A decline of 1.44% has been observed in the asking rents of 3-bed flats in Al Raha Beach, which were rented out at an average of AED 165k during H1 2022.
Corniche Area has also maintained its appeal for tenants who wish to rent luxury flats in Abu Dhabi. The average yearly rents of apartments in Corniche Area have dropped across the board, with some units showing a decrease of up to 11%. This could be attributed to the properties in the popular Al Jowhara Tower, Nation Towers and Meera Time Towers being listed at lower prices. Apart from these areas, tenants have largely gravitated towards areas like Yas Island and Corniche Road to rent luxury flats in Abu Dhabi.
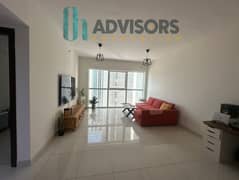
- 1 BED
- |
- 2 BATHS
- |
- 658 SQFT
- 3 BEDS
- |
- 4 BATHS
- |
- 2090 SQFT

- 1 BED
- |
- 2 BATHS
- |
- 1222 SQFT
- 1 BED
- |
- 2 BATHS
- |
- 925 SQFT
MOHAMMED BIN ZAYED CITY IS THE MOST POPULAR AREA FOR AFFORDABLE VILLA RENTALS IN ABU DHABI
MOST SOUGHT-AFTER AREAS TO RENT AFFORDABLE VILLAS IN ABU DHABI – BAYUT & DUBIZZLE H1 2022 ABU DHABI MARKET REPORT ANALYSIS
POPULAR AREAS | 3-BED Avg. Yearly RentChange from H2 2021 | 4-BED Avg. Yearly RentChange from H2 2021 | 5-BED Avg. Yearly RentChange from H2 2021 |
|---|---|---|---|
| Mohammed Bin Zayed City | 3-BED Avg. Yearly RentChange from H2 2021
| 4-BED Avg. Yearly RentChange from H2 2021
| 5-BED Avg. Yearly RentChange from H2 2021
|
| Khalifa City A | 3-BED Avg. Yearly RentChange from H2 2021
| 4-BED Avg. Yearly RentChange from H2 2021
| 5-BED Avg. Yearly RentChange from H2 2021
|
| Shakhbout City (Khalifa City B) | 3-BED Avg. Yearly RentChange from H2 2021
| 4-BED Avg. Yearly RentChange from H2 2021
| 5-BED Avg. Yearly RentChange from H2 2021
|
| Al Reef | 3-BED Avg. Yearly RentChange from H2 2021
| 4-BED Avg. Yearly RentChange from H2 2021
| 5-BED Avg. Yearly RentChange from H2 2021
|
| Al Shamkha South | 3-BED Avg. Yearly RentChange from H2 2021
| 4-BED Avg. Yearly RentChange from H2 2021
| 5-BED Avg. Yearly RentChange from H2 2021
|
When it comes to villas, Mohammed Bin Zayed City has been the most in-demand area to rent affordable houses in Abu Dhabi. The community is well established and offers easy access to Dubai — two key characteristics which have most likely contributed to making it the capital’s most tenant-friendly community.
The average yearly rents of villas in Mohammed Bin Zayed City have recorded some fluctuations across the board. The rent of 3-bed houses in Mohammed Bin Zayed City have averaged at AED 86k, dropping by 10.37% compared to H2 2021. The rental costs for 5-bed houses in Mohammed Bin Zayed City have appreciated by 1.51% to average at AED 147k in the first half of 2022.
Khalifa City A is another family-family area that has been highly viewed by tenants interested in affordable villa rentals in H1 2022. The prices of 3-bed rental villas in Khalifa City A have risen by 7.15%, averaging at AED 140k in H1 2022. On the other hand, the cost of 4-bed houses for rent in Khalifa City A has declined by 1% to average at AED 146k. Those looking for bigger houses in Khalifa City A have paid AED 163k as annual average rent for 5-bed villas in the community, following a slight increase of 0.43% in rental costs during H1 2022.
In addition to these areas, Shakhbout City (Khalifa City B), Al Reef and Al Shamkha South have been popular for renting budget-friendly houses in Abu Dhabi.
AL MUSHRIF IS THE MOST POPULAR AREA FOR RENTING LUXURY VILLAS IN ABU DHABI
MOST POPULAR AREAS TO RENT LUXURY VILLAS IN ABU DHABI – BAYUT & DUBIZZLE H1 2022 ABU DHABI MARKET REPORT
POPULAR AREAS | 4-BED Avg. Yearly RentChange from H2 2021 | 5-BED Avg. Yearly RentChange from H2 2021 | 6-BED Avg. Yearly RentChange from H2 2021 |
|---|---|---|---|
| Al Mushrif | 4-BED Avg. Yearly RentChange from H2 2021
| 5-BED Avg. Yearly RentChange from H2 2021
| 6-BED Avg. Yearly RentChange from H2 2021
|
| Al Bateen | 4-BED Avg. Yearly RentChange from H2 2021
| 5-BED Avg. Yearly RentChange from H2 2021
| 6-BED Avg. Yearly RentChange from H2 2021
|
| Yas Island | 4-BED Avg. Yearly RentChange from H2 2021
| 5-BED Avg. Yearly RentChange from H2 2021
| 6-BED Avg. Yearly RentChange from H2 2021
|
| Al Raha Gardens | 4-BED Avg. Yearly RentChange from H2 2021
| 5-BED Avg. Yearly RentChange from H2 2021
| 6-BED Avg. Yearly RentChange from H2 2021
|
| Saadiyat Island | 4-BED Avg. Yearly RentChange from H2 2021
| 5-BED Avg. Yearly RentChange from H2 2021
| 6-BED Avg. Yearly RentChange from H2 2021
|
| Not available due to low/no historical inventory or influx of off-plan properties | |||
As per our data, Al Mushrif has garnered maximum consumer interest to rent luxury villas in Abu Dhabi in H1 2022. Nestled in the centre of mainland Abu Dhabi, Al Mushrif is a well-connected district, with major landmarks and amenities nearby.
When it comes to prices, the average yearly rent for villas in Al Mushrif has increased for every unit type. The cost of 4-bed rental houses in Al Mushrif has averaged at AED 175k, increasing by 4.13% from H2 2021. In the same vein, the rental costs of 5 and 6-bed villas for rent in Al Mushrif have appreciated by 4.19% and 3.90%, to average at AED 195k and AED 212k, respectively.
Next on our list is Al Bateen, a waterfront area that has retained its popularity in H1 2022. The asking rents of 4-bed villas in Al Bateen have increased by 4.07%, averaging at AED 230k in H1 2022. These units are relatively newer constructions available in limited numbers, which pushes their rental costs upwards to match the steady demand for newer properties in the area.
The prices for 5-bed rental houses in Al Bateen have decreased by 3.50% to average at AED 216k in H1 2022. 6-bed units, on the other hand, have recorded a price hike of 8.31%, averaging at AED 244k in the first half of this year.
Those looking for high-end rental villas in Abu Dhabi have also expressed their interest in areas like Yas Island, Al Raha Gardens and Saadiyat Island.
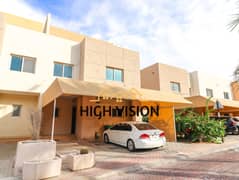
- 5 BEDS
- |
- 6 BATHS
- |
- 2940 SQFT
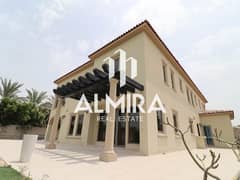
- 5 BEDS
- |
- 6 BATHS
- |
- 6097 SQFT
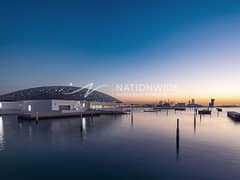
- 4 BEDS
- |
- 5 BATHS
- |
- 5057 SQFT
That concludes our H1 2022 Abu Dhabi rental market report. If you’re keen to know how sales prices have fared in the capital, Bayut & dubizzle’s Abu Dhabi H1 2022 sales real estate report has all the answers.
We have also released the Dubai H1 2022 rental market report and H1 2022 Dubai sales market report which offer detailed insights into how the emirate’s real estate market has performed in the first 6 months of 2022.
Disclaimer: The above report is based on prices advertised on Bayut.com and dubizzle.com by real estate agencies on behalf of their clients. These prices are not representative of actual real estate transactions conducted in Abu Dhabi.


